Stage 6 – Declan Dunham to Emma Reed

Overall, I think your project was excellent! The German refugee crisis is still an ongoing issue today. I believe you did a good job explaining the causes of this crisis, as well as, the effects of this crisis. However, there is a clear topic for this project, but not a clear thesis. You state that you are examining the refugee crisis and its relationship with the unemployment rate. What about the relationship? Here, I do not see a clear argument. 

It was very helpful to give the audience an understanding of this crisis. Your timeline was excellent and provided very important background information. Your first map offers a great insight into the exact amount of refugees coming into Europe. It is also a great way of showing exactly how many more refugees are coming into Germany. 

In your unemployment section, you did a good job of explaining the unemployment rate in Germany. The map you used to show the relationship between the foreign-born population and the unemployment rate worked very well. As the reader, you can clearly see the correlation between the two. 

As this is a History class, it would have been advantageous if you added a Historiography section to your project. This would allow me to see what perspective you are researching this from. It would also allow me to see any of the biases you may have implemented. 

Again, I thought this project was very thought-provoking as it would allow for the continued discourse on this topic. 

Stage 3: Declan Dunham

Sources: 

Ambrose, Stephen. Undaunted Courage. New York: Simon and Shuster, 1996. 

  • This book explains the narrative of the Lewis and Clark Expedition. Going into detail, this book provides the stories, triumphs, and conflicts the Corps of Discovery encountered. This book will allow me to provide context regarding information about the Native American tribes, plants and animals, the men of the expedition. This book also divides the expedition into sections, which will provide quick and easy information. 

Bedini, Silvio A. “The Scientific Instruments of the Lewis and Clark Expedition.” Great Plains Quarterly 4.1.(1984): 54–69.  https://lewisandclarkjournals.unl.edu/item/lc.sup.bedini.01 

  • This article discusses the scientific aspect of the expedition. Stemming from the Enlightenment, the expedition of Lewis and Clark made a great deal of discoveries that were new to Western Science. President Jefferson provided Lewis and Clark access to all of the most innovative scientific instruments at the time. This includes the octant, sextant, and much more. This source will allow me to understand how Lewis and Clark made their scientific discoveries. 

Clark, William, Thomas W. Dunlay, Meriwether Lewis, and Gary E. Moulton. The Definitive Journals of Lewis & Clark. Lincoln: University of Nebraska Press, 2002. 

  • This book is the complete collection of the Journals of Lewis and Clark. This includes their thoughts on native american tribes, the land, and the events of the expedition. These accounts provide me with the ability to understand Lewis and Clark’s personal views on the expedition. 

Discover Lewis and Clark. “Discover Lewis and Clark.” Accessed April 2, 2024.  https://lewis-clark.org/sciences/geography/landsat-over-lolo/

  • This website is a collection of different documents, writings, and images about the Expedition. This source includes biographies of the members of the Corps of Discovery, maps used/created by the Corps, and pictures of the plants and animals discovered by the Corps. This will give me a stronger and more in-depth narrative of the expedition. 

Hoxie, Frederick E., and Jay T. Nelson. Lewis & Clark and the Indian Country : The Native American Perspective. Urbana: University of Illinois Press, 2007.

  • This book discusses the Lewis and Clark Expedition from a different point of view. Through discussing the expedition from the Native American perspective, we see this adventure in a unique way. This book will allow me to better see how Lewis and Clark interacted with each tribe and how these interactions benefited U.S. trade. 

Jackson, Donald. Letters of the Lewis and Clark Expedition, with Related Documents, 1783-1854. Urbana: University of Illinois Press, 1962. 

  • This book comprises the letters and records of the expedition. This includes letters to and from Thomas Jefferson and records of plants and animals. This source will allow me to understand the expedition from a diplomatic perspective. These letters and records will help me better understand the motives and repercussions of the expedition. 

Larsell, O. “Medical Aspects of the Lewis and Clark Expedition.” Oregon Historical Quarterly 56, no. 3 (1955): 211–25. http://www.jstor.org/stable/20612203.

  • This journal will allow me to understand the expedition’s effect on medicine. This source provides me with information as to the techniques and observations produced from the expedition. 

Outright, Paul Russell. Lewis and Clark: Pioneering Naturalists. Urbana: University of Illinois Press, 1969.

Peterson, Merrill D. etd., Thomas Jefferson:Writings. New York: Literary Classics of the United States, 1984.  

  • This source contains letters and writings written by President Thomas Jefferson. This book contains letters written to Merriwether Lewis in regards to the expedition. This book will allow me to better understand Thomas Jefferson and his scientific motives.

University Nebraska-Lincoln. “Lewis and Clark Journals – Maps.”  Accessed April 2, 2024. https://lewisandclarkjournals.unl.edu/images/maps 

  • This source contains the map that were used and created by Lewis and Clark. These maps showcase the rivers, mountains, and plains that crossed the expedition’s path. This source will allow me to view the expedition from above. It will also provide a great base map for my project. 

Data:

Discover Lewis and Clark. “The Astronomy Notebook.” Accessed April 2, 2024 https://lewis-clark.org/sciences/geography/celestial-data/astronomy-notebook/  

  • This source provides celestial data from the observation of Lewis and Clark. This data contains details of longitude and latitude, river points, and much more. This source will allow me to better understand the use of scientific observation during the expedition.

Discover Lewish and Clark. “Landsat over Lolo.” Accessed April 2, 2024 https://lewis-clark.org/sciences/geography/landsat-over-lolo/ 

  • This data provides satellite images of the Lewis and Clark Trail. This data highlights the river routes and the overland routes the expedition traveled on. This data will allow me to understand the expedition from a modern viewpoint. I will be able to see how the land has changed since the expedition. 

Laliberte, Andrea S, and William J. Ripple. “Wildlife Encounters by Lewis and Clark: A Spatial Analysis of Interactions between Native Americans and Wildlife.” Bioscience 53, no. 10 (2003): 994–1003. https://go.gale.com/ps/i.dop=BIC&u=creighton&id=GALE|A109405712&v=2.1&it=r&sid=summon

  • This source provides data that highlights the population of different wildlife species along the expedition’s route. These animals include buffalo, elk, and several other species. Many of these species were new to Western Science. This data will allow me to better understand the different regions that the Corps traveled through. 

Native Land Digital. “Native Land.” Accessed April 2, 2024.  https://native-land.ca/    

  • This source shares the land of every Native American tribe, specifically the region in which the Corps of Discovery traveled. This source will allow me to understand the geographic nature of the expedition in relation to Native Americans. This will also help me understand Native American trade relations. 

Preston, Vernon. Lewis and Clark: Weather and Climate Data from the Expedition Journals. 1st ed. Vol. 6. Boston, MA: American Meteorological Society, 2007. 

  • This book discusses the weather and climate observations of Lewis and Clark. This data showcases the climate of the plains, mountains, and the Pacific Northwest. Using this data, I could visualize Lewis and Clark’s impact on our understanding of todays climate. 

United States Census Bureau. 1860 Census: Agriculture of the United States. Data.Census.Gov <https://www.census.gov/library/publications/1864/dec/1860b.html>, 1860.   

  • This Census Bureau data showcases the Agriculture production in 1860.  This data highlights crop production, farm acreage, and cattle. This data will allow me to visualize the growth of the American West as a result of the expedition. I will use the journals and observations of Lewis and Clark to note the men’s view of the land. 

United States Census Buerau. 1900 Census: Volume I. Population, Part 1. Data.Census.Gov <https://www2.census.gov/library/publications/decennial/1900/volume-1/volume-1-p5.pdf>, 1900. 

  •  This Census Bureau data showcases population movements in 1900. This data shares the population and settlement increase within the United States. This data will help me discover how the expedition impacted American expansion. I will look at all the states and territories that thye Corps traveled through. 

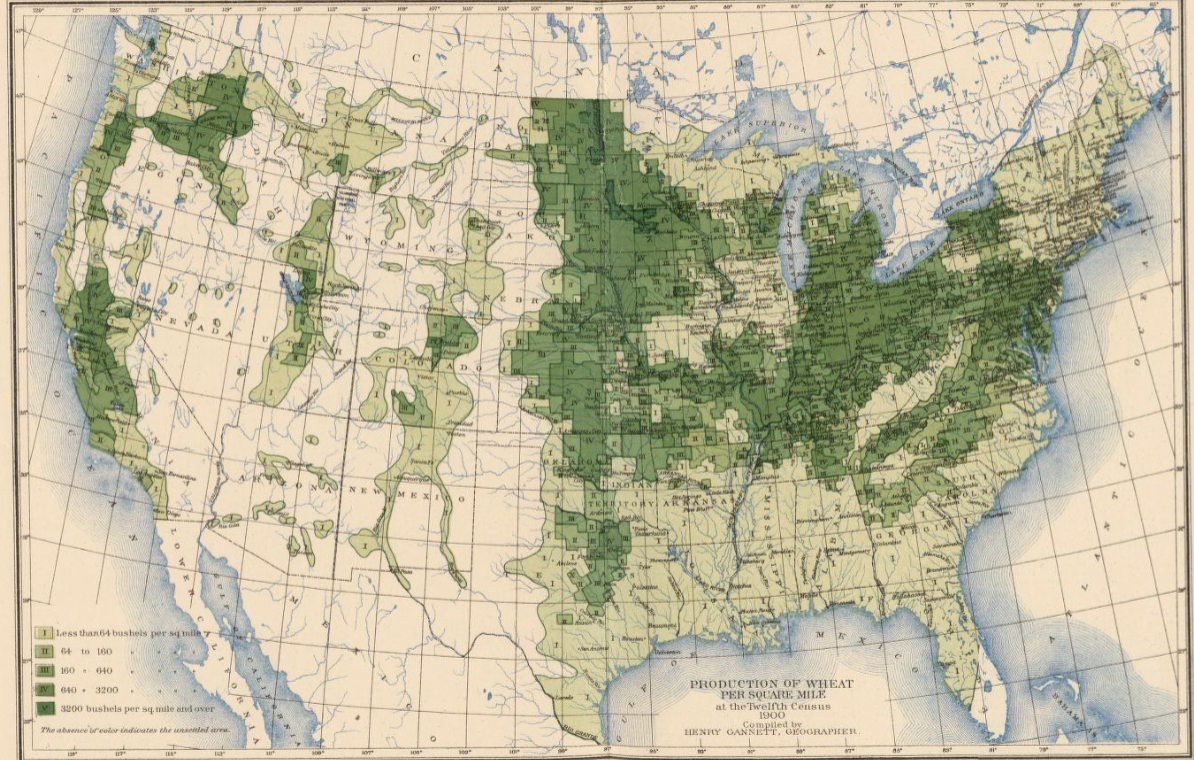
United States Census Bureau. 1900 Census: Volume V. Agriculture, Part 1. Data.Census.Gov <https://www.census.gov/library/publications/1902/dec/vol-05-agriculture.html>, 1900.   

  • This Census Bureau data showcases the Agriculture production in 1860.  This data highlights crop production and cattle. This data will allow me to visualize the growth of the American West as a result of the expedition. I will use the journals and observations of Lewis and Clark to note the men’s view of the land.

United States Census Bureau. 1900 Census: Volume V. Agriculture, Part 2. Data.Census.Gov https://www.census.gov/library/publications/1902/dec/vol-06-agriculture.html>, 1900.

  • This Census Bureau data showcases the Agriculture production in 1860.  This data highlights total farm acreage and total farms in each state. This data will allow me to visualize the growth of the American West as a result of the expedition.  I will look at all the states and territories the Corps traveled through. I will also use the journals and observations of Lewis and Clark to note the men’s view of the land. 

University Nebraska-Lincoln. “Lewis and Clark Journals: Images of Plants and Animals”. Accessed April 2, 2024. https://lewisandclarkjournals.unl.edu/images/plants_animals 

  • This source provides the names of every plant and animal the expedition encountered. This source also provides a detailed description of these discoveries. This data will allow me to better understand the impact of the Corps’ botanical and wildlife discoveries. 

Blog Post 8: Declan Dunham

The Jim Crow era is a dark chapter of American History. African Americans across the country experienced discriminatory laws. Among some of the challenged African Americans faced were lynchings. When mapping racial history, like lynchings, it is important to be mindful of the ethical ideas surrounding it.

According to Katherine Hepworth, ethical implications can vary. She writes, that these maps are “demonstrating how choices about representation, interaction, and annotation in their data visualizations either do harm in the sense described above, or challenge dominant narratives” 1. In other words, when it comes to mapping race, representation and how we define our terms matter. These maps highlight the importance.

Equal Justice Initiative
Map of White Supremacy Mob Violence

In both of these maps, we see visualizations of racial violence across the United States. In the first map, created by Equal Justice Initiative, we see it centered on the Southern United States. Granted, a majority of racial violence occurred in the South, however, the first map gives you the idea violence outside of the South was nonexistent. In the Map of White Supremacy mob violence, we see much more detail and inclusivity. This map highlights White Supremacy mob violence which includes every racial minority group. This includes, Chinese, Black, Italian, Latinx, and Native American. This map also shares details about each individual case.

Map of White Supremacy Mob Violence, Miles Taylor

Besides representation, how we define our term matters. According to Plain Talk History, there are two definitions of “Lynching”. A strict definition of lynching is when the lynchers “believed they were righteous, never worried they might face charges. To them, a dead victim meant justice: the matter was settled, and townspeople would move on” 2. The broader definition of lynching is the belief when “perpetrators did not claim to be agents of justice. They knew it was murder—in their rage, they didn’t care. This was a homicidal spree to avenge the established order” 3. As you can see, these two defintions of lynching are different. Because of this, how you define “Lynching” means including or excluding a wide variety of victims.

In conclusion, when mapping racial violence, it is important to understand representation. This means that we need to think about who we want to include and how we want to include them. To do this, we must be able to define what we are researching. By doing this, we create the ability to expand or reduce our representation.

  1. Hepworth, Katherine & Christopher Church. 2018. “Racism in the Machine: Visualization Ethics in Digital Humanities Projects.” Digital Humanities Quarterly, 7.  ↩︎
  2. Monroe & Florence Work Today. 2016. “Map of White Supremacy Mob Violence.” PlainTalkHistory ↩︎
  3. Monroe & Florence Work Today. 2016. “Map of White Supremacy Mob Violence.” ↩︎

Week 9 Practicum – Declan Dunham

1880
1900

1940

Since 1880, population in the Midwestern states has grown significantly. As population grew, land use grew as well. These maps demonstrate the change in land cultivation through 60 years. It also shows American settlement in the West. At first, a majority of the land cultivation was along the Kansas-Missouri border. As the population grew, settlement along with cultivation moved westward. American Westward Expansion is highlighted through increased cultivation brought by continuous settlement.

Stage 2: Declan Dunham

In this project, my question is, “Did Lewis and Clark treat plants and animals as organisms or natural resources?”. I will present the Lewis and Clark expedition by exploring their observations of plants, animals, and rivers. By looking at the journals of those in the Corps of Discovery, I will note their observations of the land’s economic versatility. I will then demonstrate how the land they observed is used today.

This map will look at the entire route of the Lewis and Clark Expedition. Each slide will consist of Lewis and Clark’s land observation and journal entries as well as its economic use today. I will share journal entries and other forms of data starting in St. Louis, Missouri, through the Missouri River, over the Rockies, and to the Pacific. 

Some possible sources consist of primary and secondary sources. The Lewis and Clark Journals and maps that the Corps created will allow me to view the expedition from their perspective. Other sources, such as U.S. Census Data, will allow me to see how this land has been is currently being used. I can find these resources through different libraries, museums, and scholarly articles. 

The final version of my project will be an interactive web map. This map will take you through the expedition starting in St. Louis, and ending in the Pacific. The use of this type of map will allow you to become a member of the Corps of Discovery. By using this mapping technique, you will better understand their observations and its results. 

This project is important to scholarship because it gives and new interpretation of this expedition. Oftentimes, we look at the Lewis and Clark expedition as an act with political intentions. Although there were political motives, there were also scientific ones. This approach looks at this expedition through an Enlightenment perspective. Thomas Jefferson saw the usefulness and the scientific value of this newly acquired territory. This project will allow the audience to better understand how Lewis and Clark’s scientific observations had great economic usefulness.

Declan Dunham – Heat Maps and Voronoi Polygons

Using Heat Maps and Voronoi Polygons will also be useful when maping War. Among other propositions, these maps can include military base locations, personel, and resources. By doing this, we will be able to track other nation’s military strength and movements.

For my final project, I can use Heat Maps and Voronoi Polygons when demonstrating the location and density of plants, animals, and Native American Tribe. This would allow me to better understand Lewis and Clark’s observations. Also, I would be able to map locations of settlements in these areas.Through this, I would be able to show how Lewis and Clark’s expedition led to economic growth in the prarie states.

Week 9 Blog Post: Declan Dunham

In the mid to late 1800s, settlement in the Midwestern Prairie grew. As of result of the Homestead Act, settlers began establishing farms and settlements. According to Geoff Cunfer, “The federal government encouraged an expansion of production and provided
financial incentives for new plow-ups” 1. This area, known as the grasslands, had rich soil that made it easy to produce crops. Due to this, the grasslands were gradually plowed to fit this need of production.

Percentage of total county area not plowed, 1880-1920. Geoff Cunfer

As you can see, the percentage of grassland in this region significantly decreased during the early years of settlement and agricultural production. One of the main crops grown during this era was wheat. In the early 1900s, Wheat became an essential crop to the agricultural industry. According to Cunfer, “Generous rainfall accompanied the population and land boom” 2. As a result, wheat and other crop production increased. From this, farmers across the region saw an increase in wealth. Henry Gannett’s map of the 1900 Wheat Production highlights this.

Production of Wheat Per Square Mile at the Twelfth Census, 1900. Henry Gannett

Due to the increased use of land and population increase, crop production declined. By 1920, the lack of rainfall prevented crop production. Farmers began plowing more land for production. By continuously plowing fields, the soil became infertile. Amid the Great Depression, crop production was at a low, and many farmers suffered. During this, farmers began adapting. Cunfer writes, “the true period of adaptation was in the transition era, between about 1930 and 1940, when farmers first reached the natural limits of environment, passed them, and were pulled back by nature” 3. As a result of this land use, Midwestern farmers began adapting the harsh conditions that this region could bring.

The growing use of land for agriculture in the Midwest during the late 1800s – early 1900s, provided increased production in many crops such as Wheat. However, this also came with many challenges due to human practices, and a harsh climate. Land overuse and an increasing population in the 1920s created devastating effects through a decrease in production. As a result, farmers learned that land can be unforgiving. Through this, farmers began adapting.

  1. Geoff Cunfer, “Pasture and Plows,” On the Great Plains, 2005. 25 ↩︎
  2. Geoff Cunfer, “Pasture and Plows,”. 23 ↩︎
  3. Geoff Cunfer, “Pasture and Plows,”. 19 ↩︎
css.php