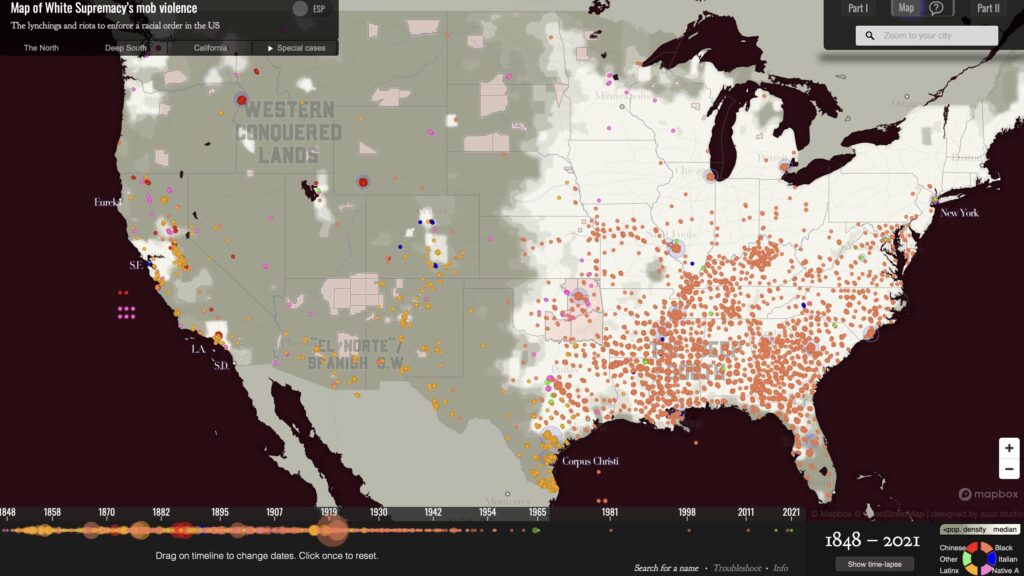
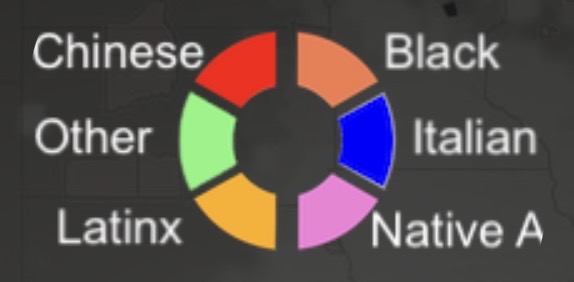
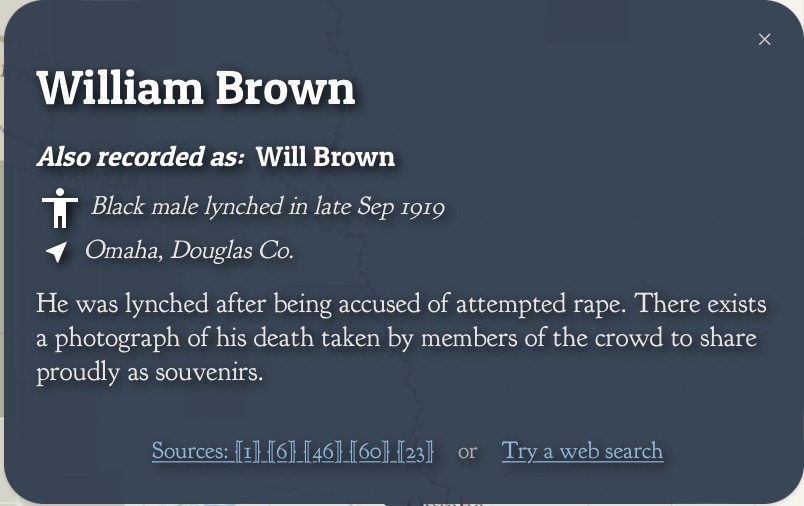
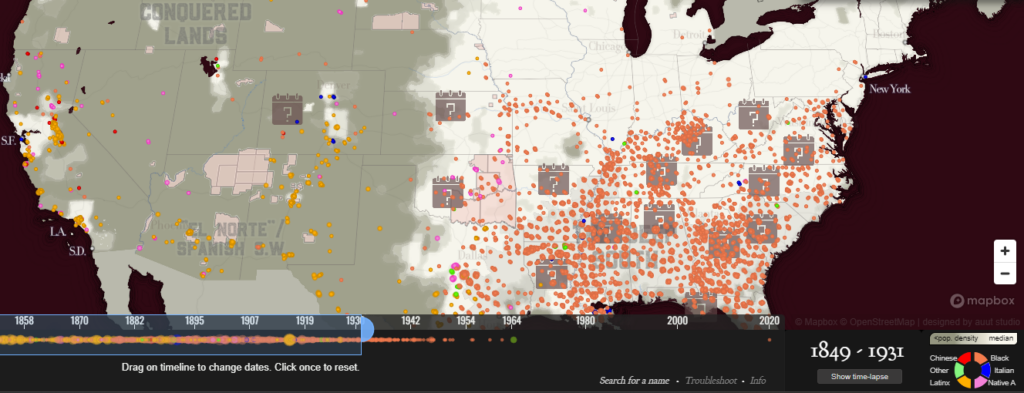
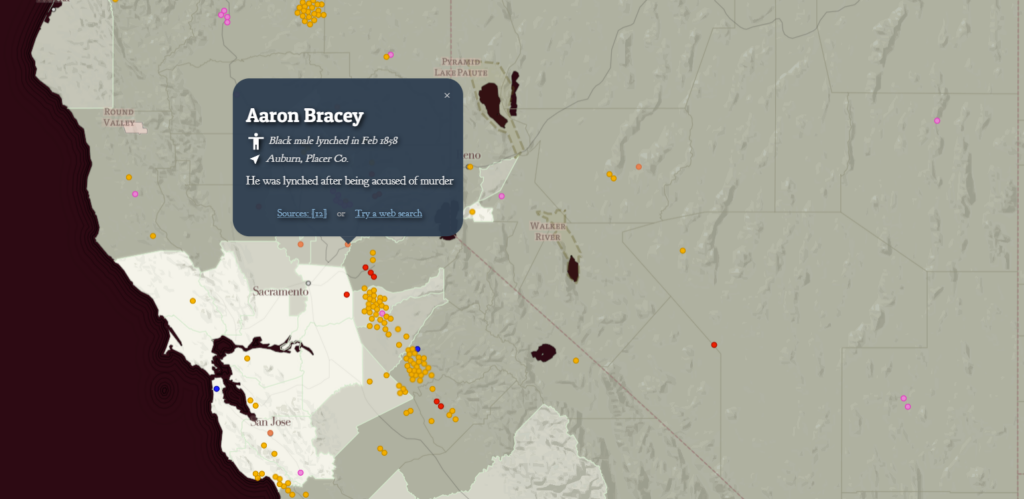
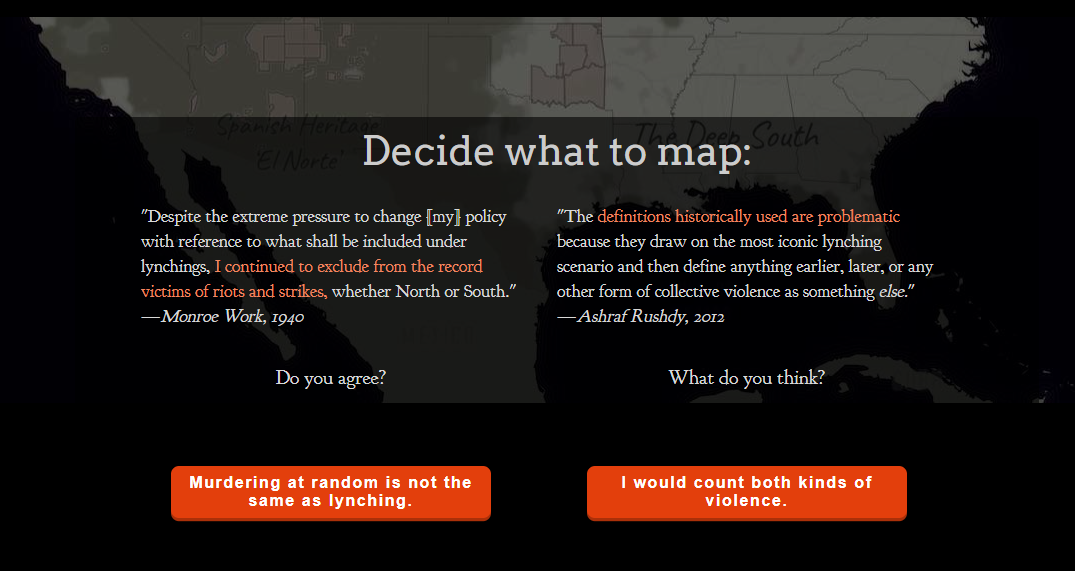
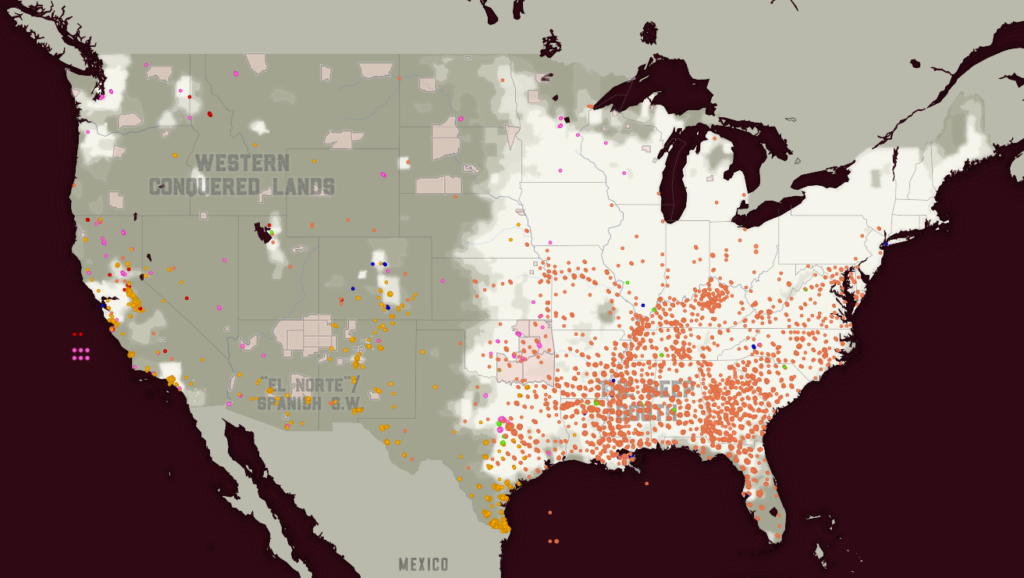
Even before reading the ethics and analysis article, I agreed that the White Supremacy Mob Violence map was a better visual representation of the dynamics at play, although there were a lot of reasons for that that didn’t occur to me. When I looked it over, one of the main things I noticed was the level of detail. The White Supremacy Mob Violence map begins with an introduction to the concept of lynchings, the structures that motivated racial violence, and the varying methods that have been used to collect and map data about it. It also invites the reader to think critically about the map and ask questions about the data. Once you’re looking at the map itself, you can change the visualization to focus on different time periods and places, as well as click on individual points to read more about them. This provides a level of detail that doesn’t sacrifice the map’s impact on a wider scale; even when you are all the way zoomed out and haven’t selected a specific time period, you can make out the general patterns of where and to whom racial violence occurred. The concentration of black victims in the south and latinx victims in the southwest, for example, is obvious without seeming universal.
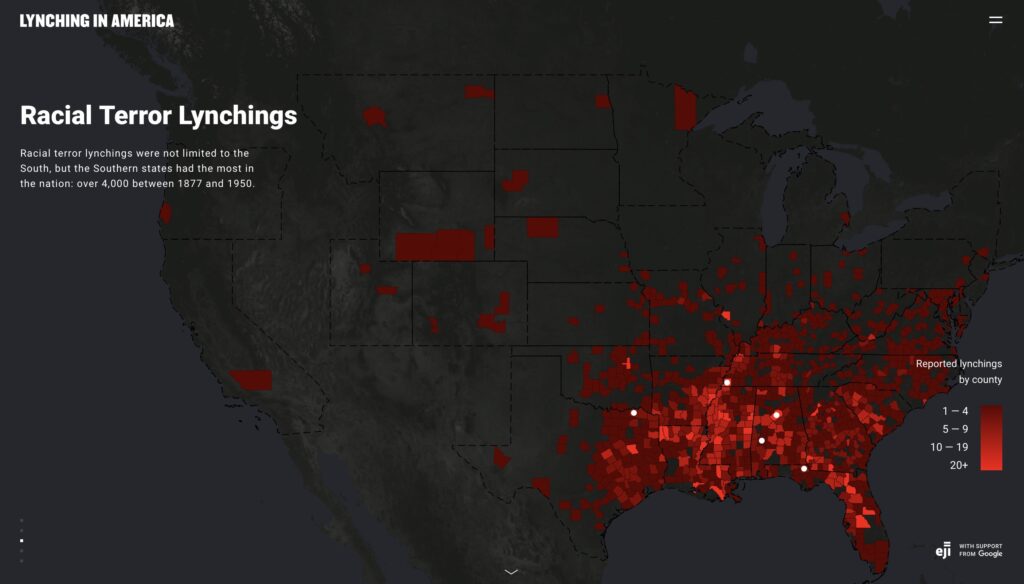
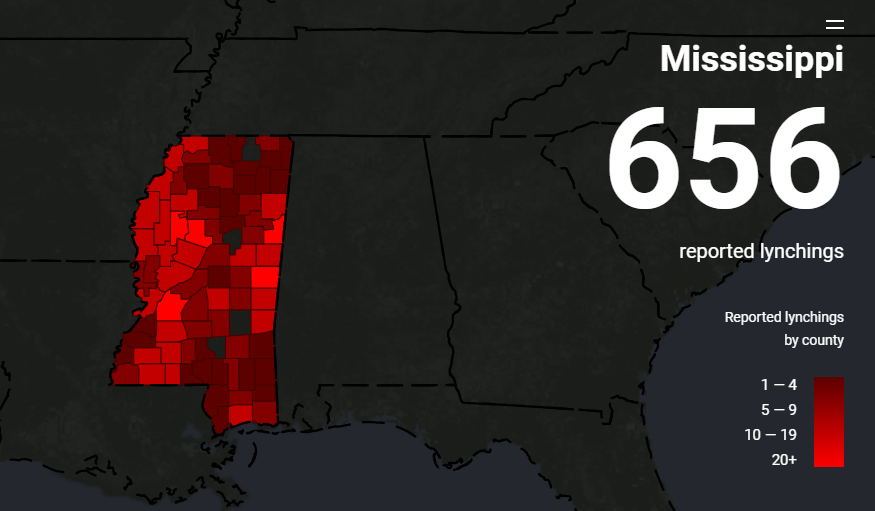
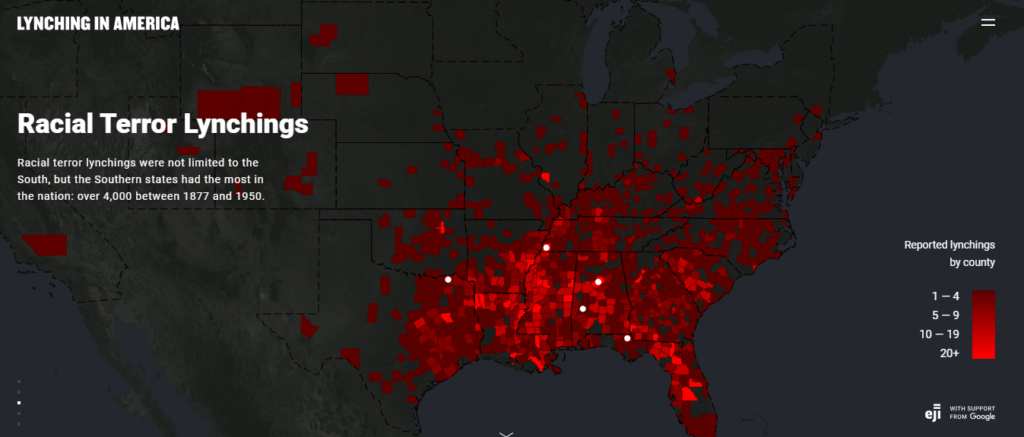
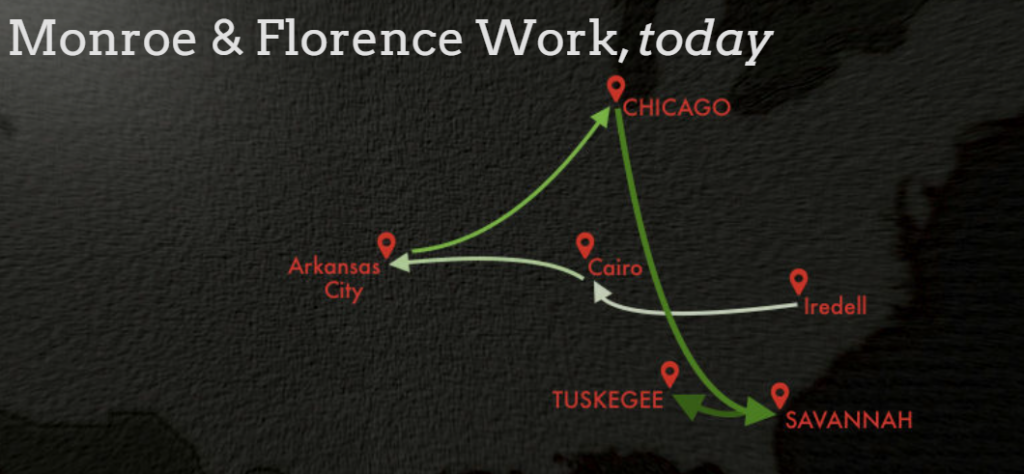
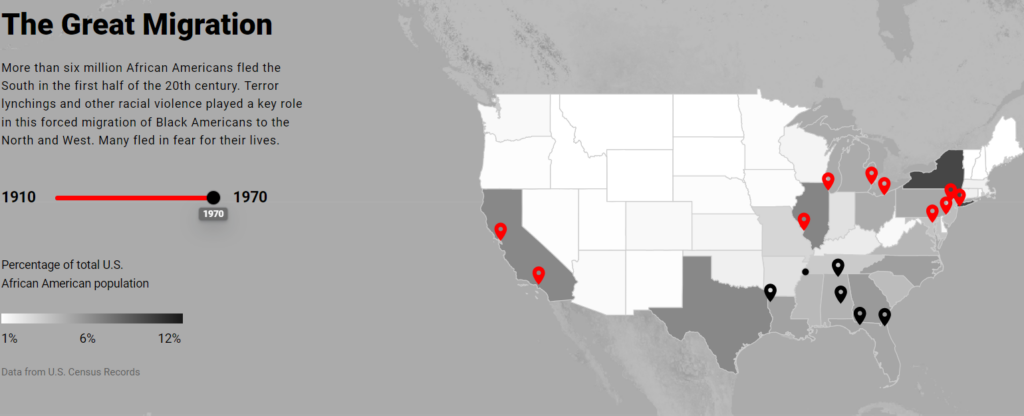
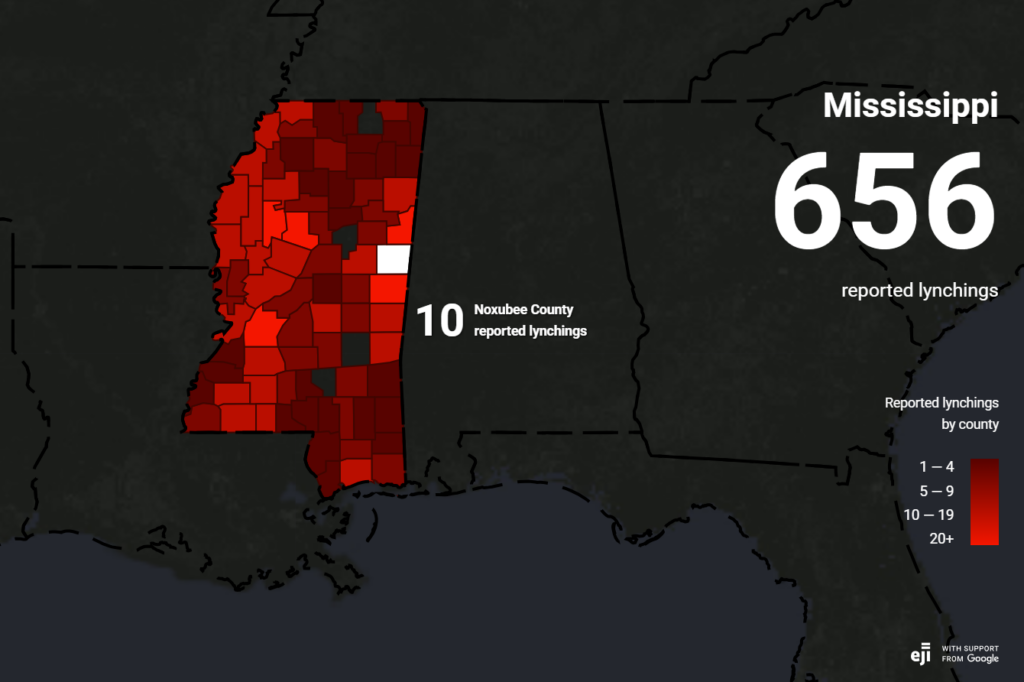
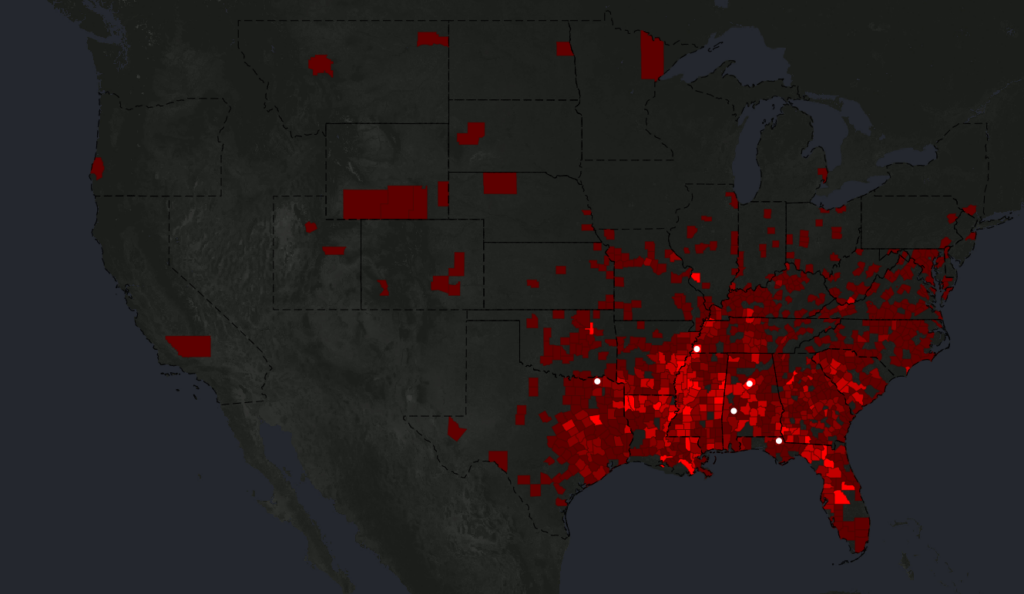
While I agree with the article’s analysis that the color choices in the Racial Terror Lynching map make it seem like lynching was almost exclusive to the South, I do think they’re effective in other ways. The red stands out very well against the dark background and suggests the right tone of alarm or violence for the subject matter. This map is also not completely without detailed accounts. It utilizes short, engaging multimedia presentations to provide detail on a few representative cases. I think that method does the job alright, even if it’s not as good as the level of detail on the other map. The main problems with this one were those discussed in the article: it focuses too much on the South, isn’t very up-front with its methods or scope, and doesn’t use normalized data.
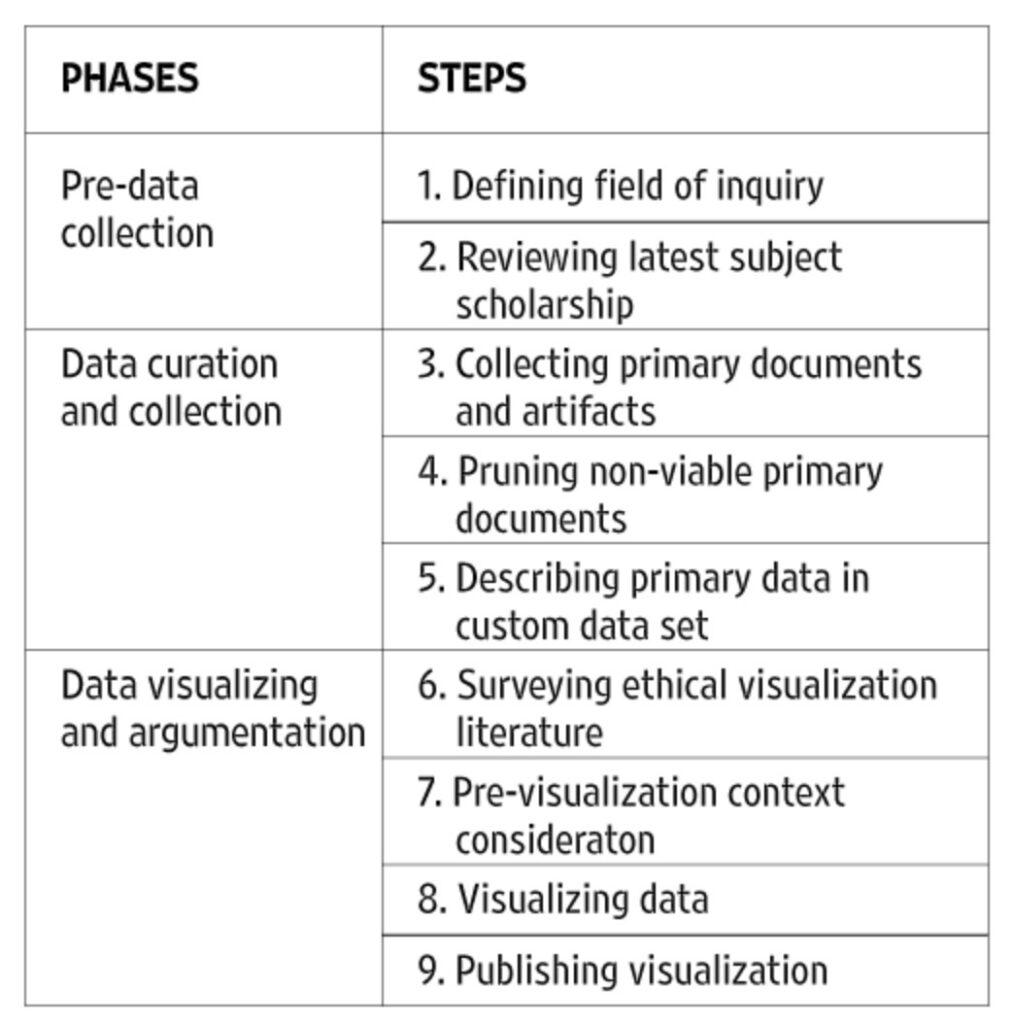
I like the method outlined in the article on visualization ethics. It makes sure ethics are considered at every step of the process and decreases the likelihood of the end product being misleading. I also agree that interdisciplinarity is a valuable way to make sure that a project is both ethical and effective. The one thing I wasn’t a fan of was the idea that the humanities need their own, new visualization methods because the existing ones are tied to colonial contexts. Yes, the article acknowledges that it’s often better to use data visualization methods people are familiar with, and yes, most of them were developed in a western colonial environment, but I don’t think charts and graphs themselves are a problem; they only become a problem when you choose the wrong type of chart for a specific topic or dataset, thus skewing the reader’s perception of what you’re trying to visualize. Traditional graphs work just fine for the humanities. Any gaps can be filled in by good captions or other accompanying text. The major strength of digital visualizations over printed ones, in this case, is the ability to incorporate those more detailed explanations into the map itself using pop-ups or links rather than having to put them on a separate page. they can live in the map, grounding them more strongly in physical space, and then dispensary when you go back to a larger scale.
In my final project, I don’t think I’ll have to consider the ethical concerns outlined in the article as much as I might if I were covering a different subject or using a different focus. The area I’m mapping is a single city park, albeit a big one, and I’m focusing on buildings and development rather than specific people or events. I’m not actually working with any datasets. I like the idea of including specific, personal stories in my map, much like in the White Supremacy Mob Violence project, but I’m not sure how feasible that is for a project of this scale. I’m not sure if I necessarily need to, with my focus being on the broader space and the ideology behind it. I think it’d probably be a good idea to include at least one personal account of one of the native people who was being exhibited at the fair in order to add in a sense of agency and make the story more impactful, but I’m not yet sure how to incorporate that.
I will need to pay careful attention to transparency in my methods, though. The historical maps I’m working from are sometimes incomplete, illegible, or missing context, which makes it hard to know for sure how to categorize every building without doing a level of research that isn’t feasible for a project of this scale. My main ethical consideration will be noting when I’m making assumptions about the purpose of a building.


