Monroe Work, a pioneer in the field of sociology, confidently asserted, “In the end facts will help eradicate prejudice and misunderstanding, for facts are the truth and the truth shall set us free” [1]. However, individuals and organizations often manipulate or misuse facts to promote their own views. For this reason, it is important to approach historical data visualization from an ethical standpoint, but although there are ways in which one can attempt to avoid bias, it is virtually impossible to eliminate entirely. This is especially true for maps because even seemingly minor elements like color, symbols, and interactivity can influence how viewers interpret data.
In “Racism in the Machine: Visualization Ethics in Digital Humanities Projects,” Katherine Hepworth and Christopher Church emphasized that to showcase data ethically, one must mitigate any harm to viewers and the subjects of a study as well as maximize the project’s ability to communicate information [2]. The authors then proposed an ethical visualization workflow that should be used when creating digital humanities projects, such as maps, to help eliminate bias and misrepresentations. The workflow introduces several steps that are part of one of three phases: pre-data collection, data curation and collection, and data visualizing and argumentation.
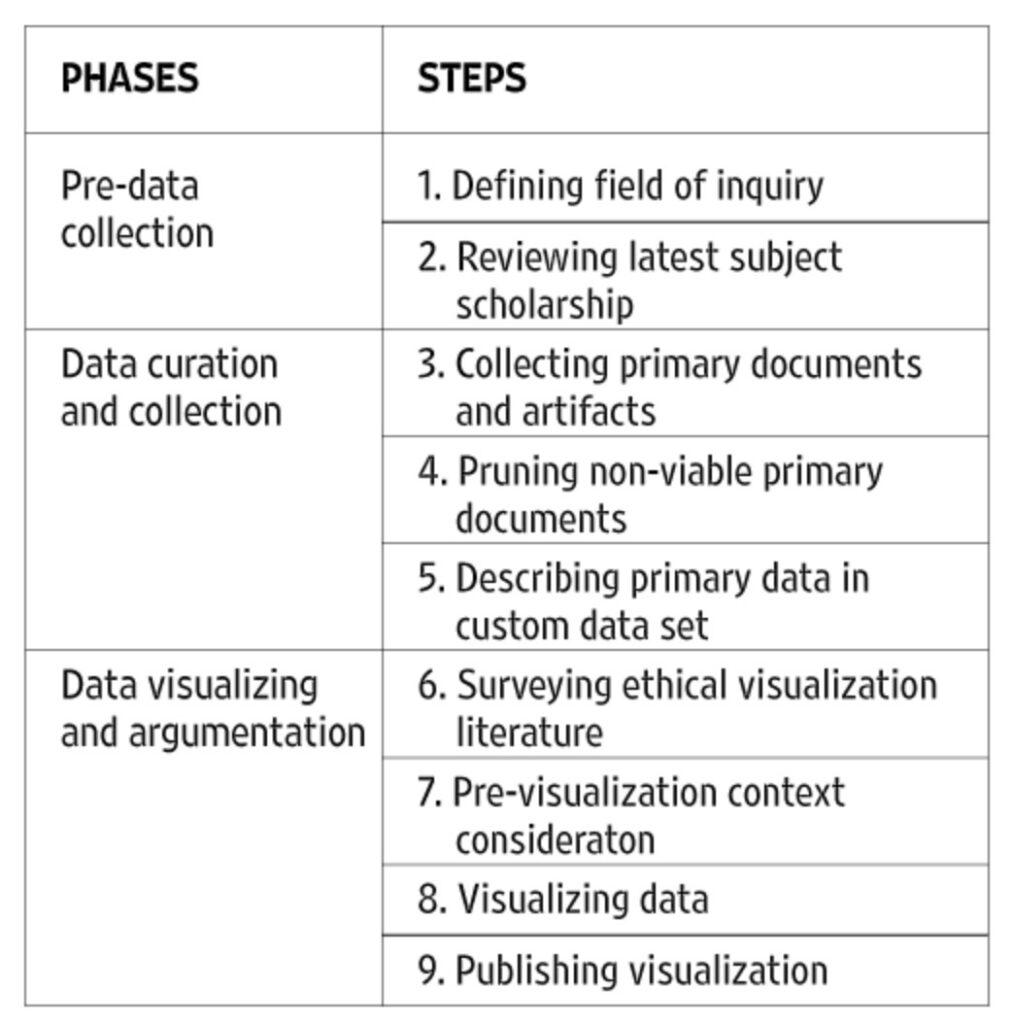
By examining two mapping projects, Hepworth and Church were able to explain how researchers can apply this ethical approach to the creation and use of data visualizations. The first map that the authors analyzed was “Lynching in America: Racial Terror Lynchings,” created by the Equal Justice Initiative (EJI). This is a choropleth map showing the number of reported lynchings (of African Americans) across US counties between 1877 and 1950.
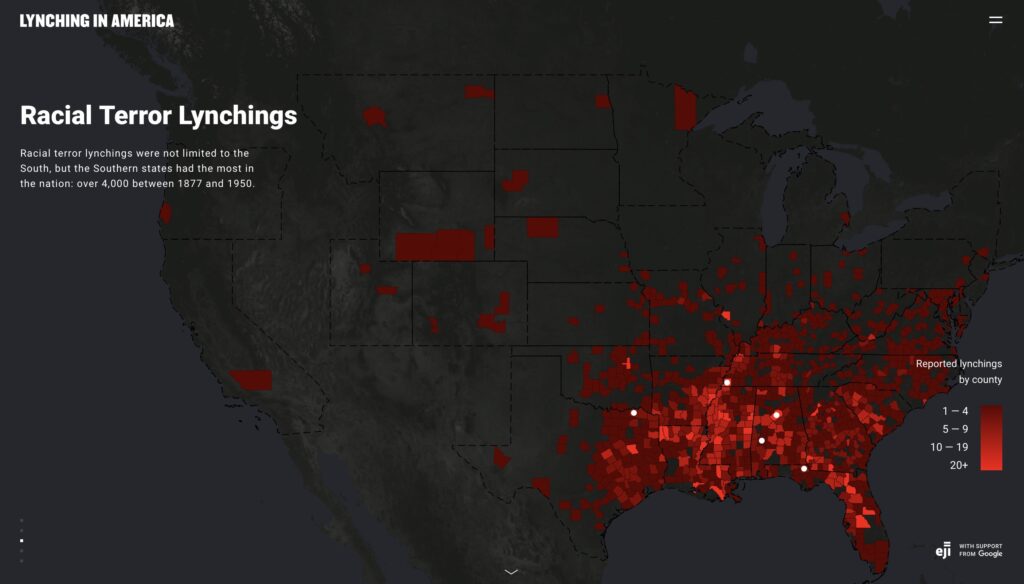
The map is visually striking. It uses a red color ramp to indicate the number of lynchings in each county, and against the dark background, this color indicates what it represents: bloodshed. Before even exploring the map and website, I was already well acquainted with EJI’s mission from previously reading Just Mercy and hearing the organization’s founder, Bryan Stevenson, speak in person at Creighton last year. Therefore, despite the map’s title suggesting otherwise, I was able to conclude that these lynchings only involved African Americans. When interpreting the map, it is important to know this background because it fuels EJI’s argument that historical violence and prejudice against blacks is at the foundation of their disproportionate representation within the current criminal justice system. Therefore, the map is merely a “promotional and advocacy tool” for EJI [2].
To most viewers, this map appears credible at first glance, especially as it is supported by Google, but on further inspection, it introduces some unethical implications. To begin with, it utilizes raw data, which is improper for a choropleth map. As Hepworth and Church noted, the number of lynchings in each county should be normalized against census population data [2]. This would eliminate any disproportionate representations of lynchings in each county. Moreover, this map also contains notable silences. As already mentioned, it solely focuses on African Americans who were lynched. The map is also limited by choices made during the data collection phase about what constitutes a “lynching.” The criteria chosen allowed EJI to create “a narrative around racial violence that excludes other minorities and other geographic locales” [2]. The map does, in fact, ignore much of the North and West, casting it in a dark color, and it primarily focuses the viewer’s attention on the South, which is bright red.
Hepworth and Church also examined “Map of White Supremacy’s Mob Violence,” a different map conveying similar but more nuanced data, which provided a better ethical visualization of racial lynching in the United States. This map, developed from research done by Monroe Work, has several key differences from the one produced by EJI that lend it greater credibility. To start, it is a complex and interactive dot density map, spanning from 1848 to 2021, which makes it relevant even in the contemporary era.
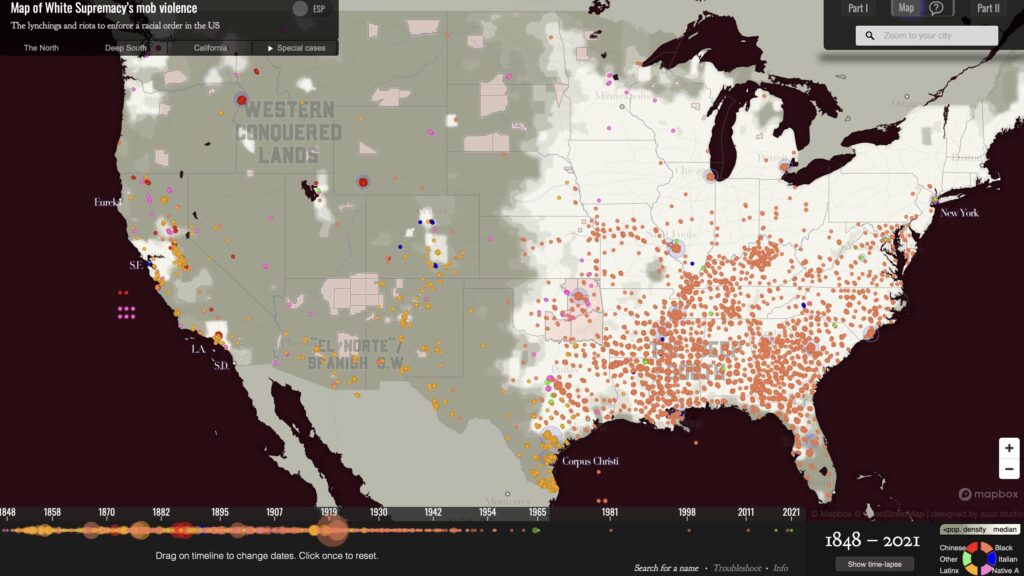
The aim of this map is arguably to “confront the user with the temporal and racial extent of white superiority-motivated lynchings, both qualities that are absent from the Racial Terrors Lynchings map” [2]. Thus, the scope of what this map covers is much larger, and it fills in gaps that the EJI did not cover. Most obviously, Work’s map includes the lynchings of several different races, not just African Americans. This demonstrates that racial violence was not limited to one group.
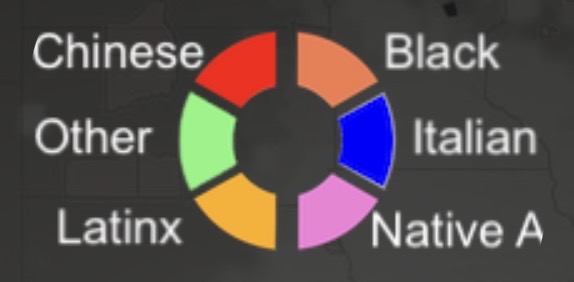
These dots are much more widespread than lynchings represented on the EJI’s map, where they were mainly clustered in the South. Additionally, each dot represents a reported lynching, including the name, where available, of every person as well as the year the lynching occurred. This information is also accompanied by a link to sources that viewers can click on to discover more. In doing so, this incorporates a sense of humanity and greater credibility into the project that EJI’s map lacks.
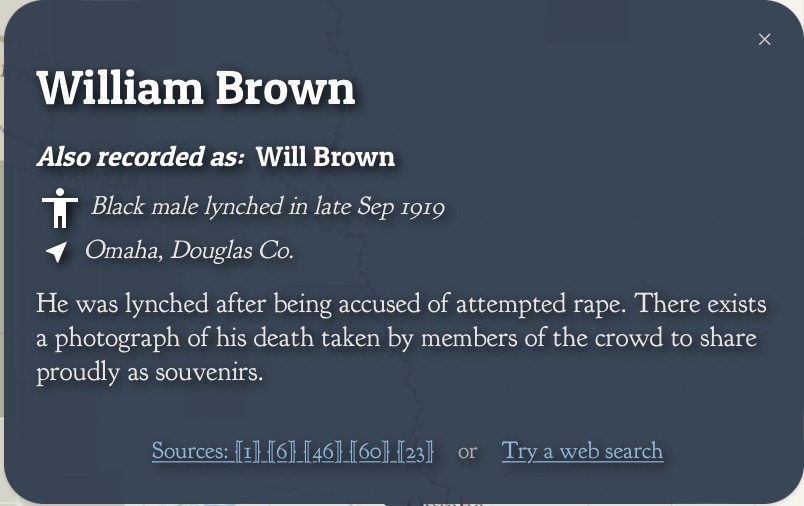
Therefore, this second map provides a better example of an ethical visualization of data. This difference is namely apparent in the two maps’ arguments and silences (or relative lack of), and this comparison demonstrates why Hepworth and Church’s proposed workflow is effective and practical.
References:
[1] Work, Monroe, and Florence Work. “Map of White Supremacy’s Mob Violence.” Plain Talk History. https://plaintalkhistory.com/monroeandflorencework/explore/map2/#4/37.85/-99.5/0/18.
[2] Hepworth, Katherine, and Christopher Church. “Racism in the Machine: Visualization Ethics in Digital Humanities Projects.” Digital Humanities Quarterly. Vol. 12, no. 4 (2018). http://digitalhumanities.org/dhq/vol/12/4/000408/000408.html.
[3] Equal Justice Initiative & Google. “Lynching in America: Racial Terror Lynchings.” https://lynchinginamerica.eji.org/explore.


Excellent work, albeit late, Erin. Wonderful contributions to discussion yesterday as well. Enjoy your break!