
This practicum observed the change of the plains region’s cultivated land or more so the overworking of the the Great Plains that created conditions leading to the dustbowl.
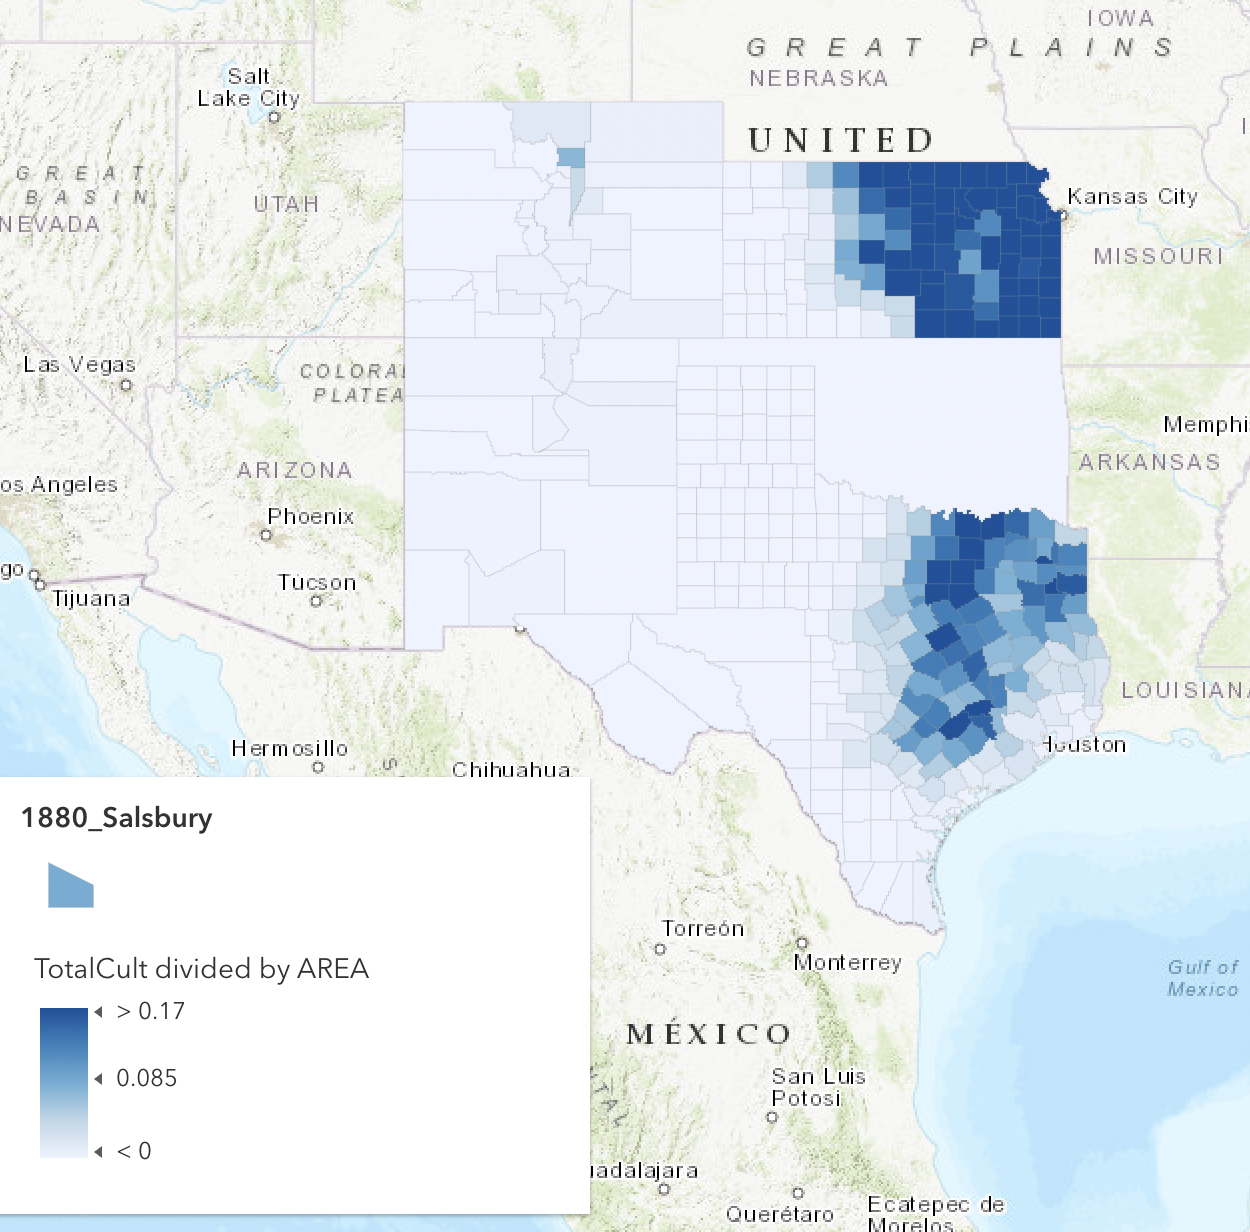
The glaring observation of this first map is that Oklahoma shows no data. This is because as of 1880 Oklahoma had not been added to the union. However looking at states with data we can see that Kansas led the region in cultivated land being a large wheat producer.
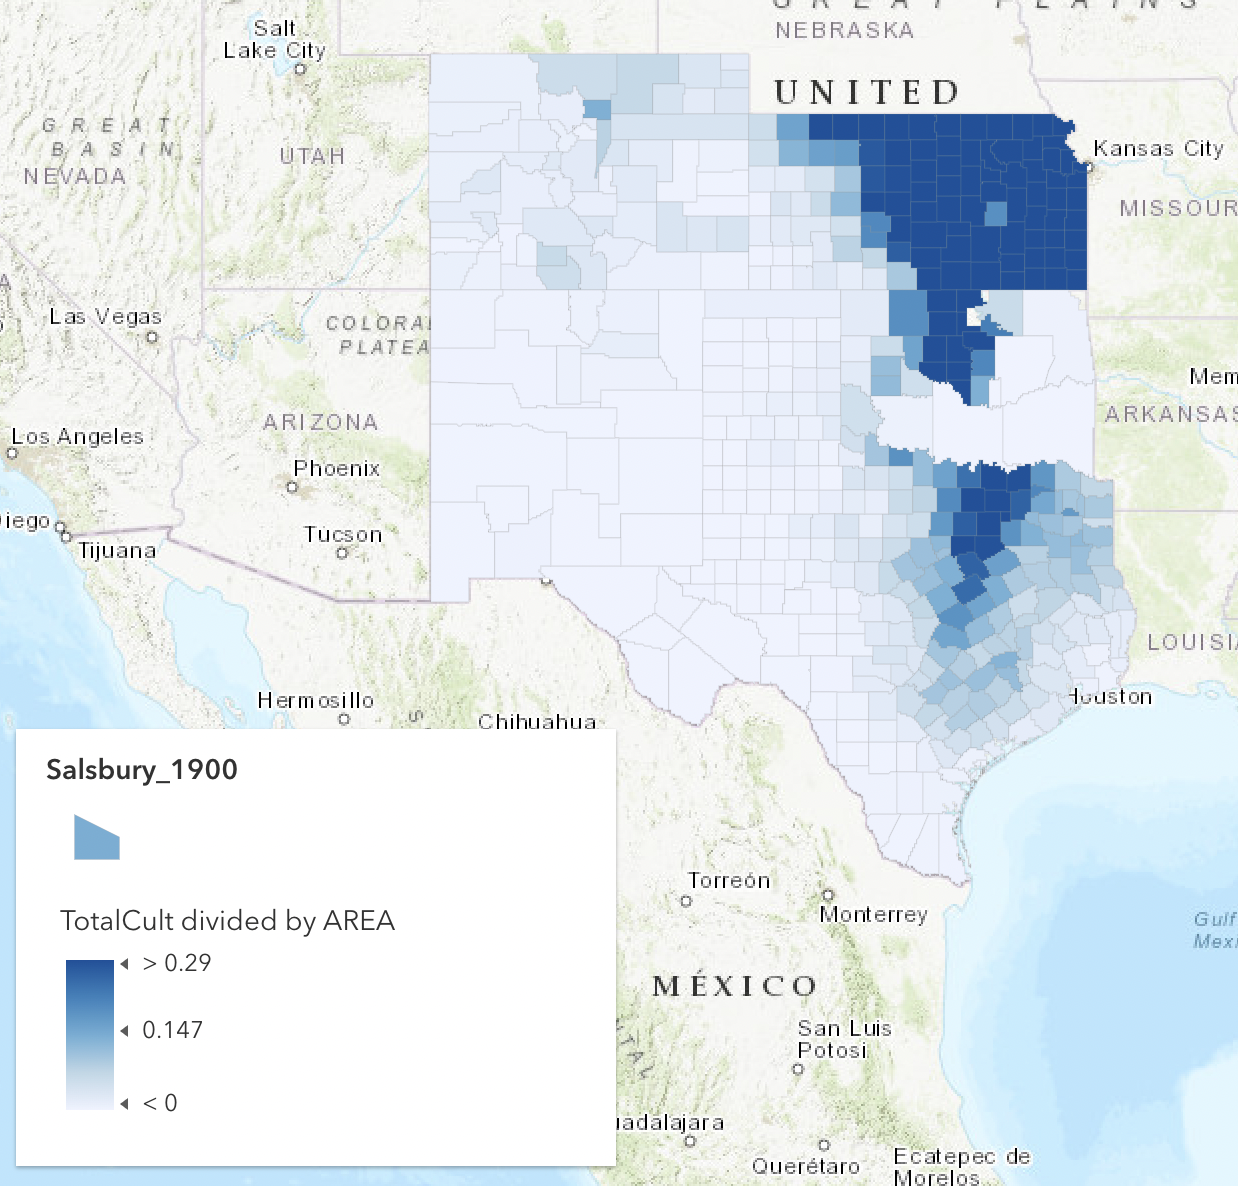
As we move into 1900 we can see land cultivation start to creep westward into Colorado and parts of West Texas. We can also see that land that was already cultivated become even more used.
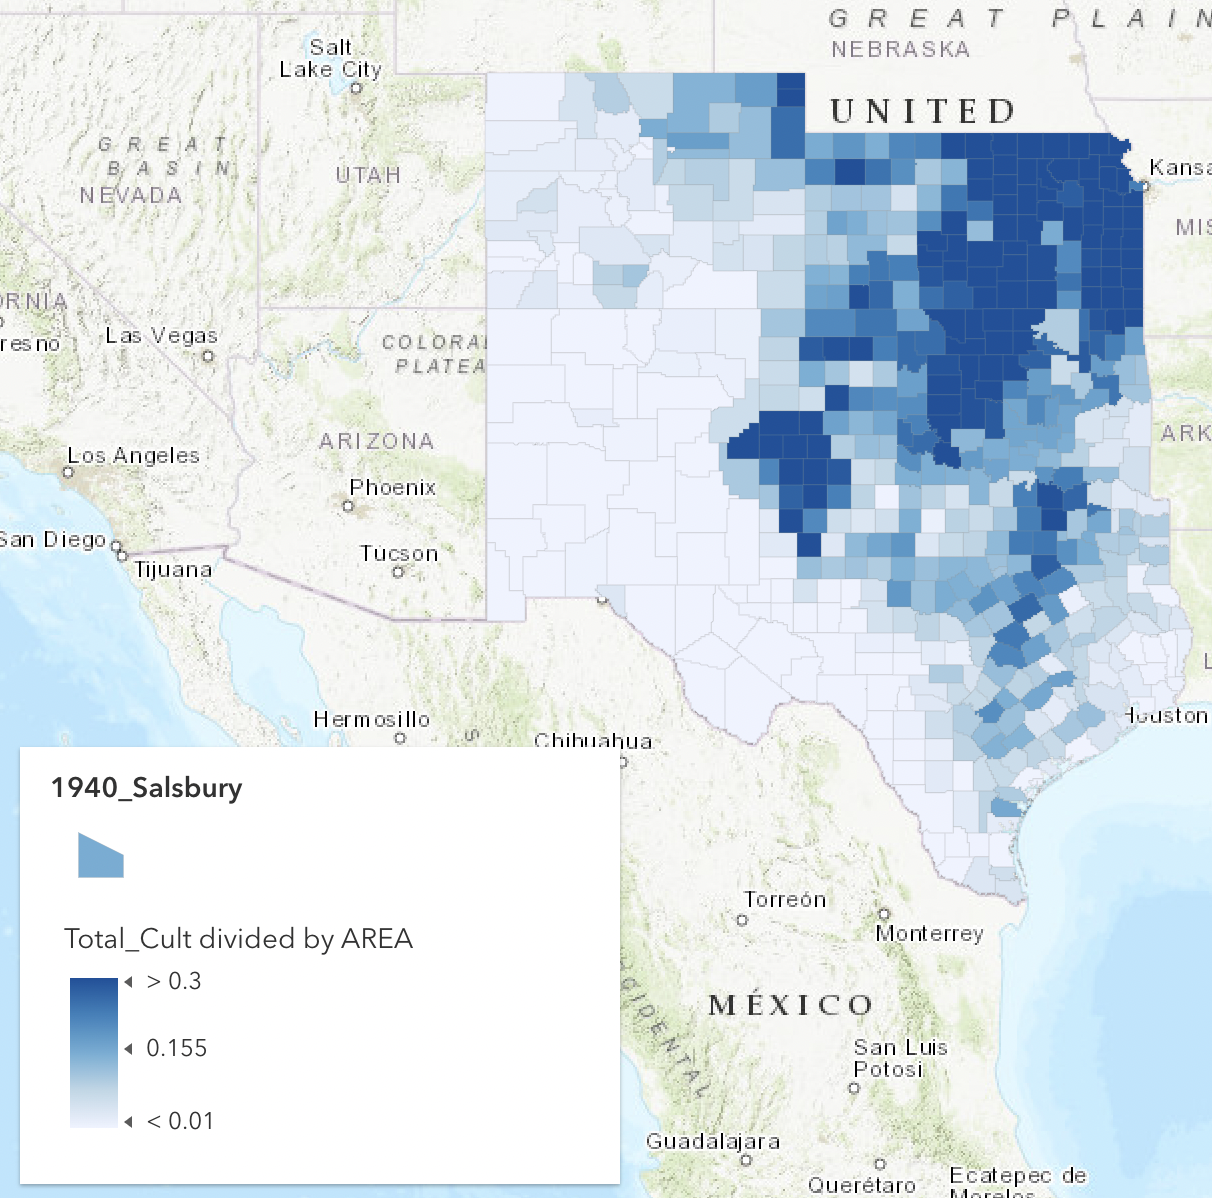
By 1940 we can see the over-cultivation of land had spread throughout the plains region and altered every state’s arable land area. We can also see more counties where they had been moderately cultivated, fall deeper into cultivation.
While the 1940s were around half a decade after the Dustbowl, we can see how there was a mass of over-cultivated land that deprived soil of hydration and protection allowing for drought to tear through torn-up farmland and blow the plains into a dust bowl.
Good! and now you’re almost caught up with practicums. Just missing the storymap.