
Statistics is a common course for undergraduate, and often high school, students. Effective statistics courses, like those I have taken at Creighton, will emphasize critical analysis of data visualizations. For example: some data may not fit clearly into certain types of graphs; some samples may be too small or narrow to answer the hypotheses being tested; while still other methods may be swayed by unstated bias. Maps are somewhat unique in that they are a form of data visualization that are often not treated as such in society and culture at large. Before taking Mapping History, I admit that I tended to view maps as blanketly authoritative. We grow up seeing a map of the nation and/or world in the back of the elementary school classroom and implicitly learn to take such depictions at face value. However, maps are ultimately a means to visualize a data-based argument. Given that cartography already carries a cultural authority of definitiveness, map-makers need be especially transparent and intentional about data collection and data depiction [1].
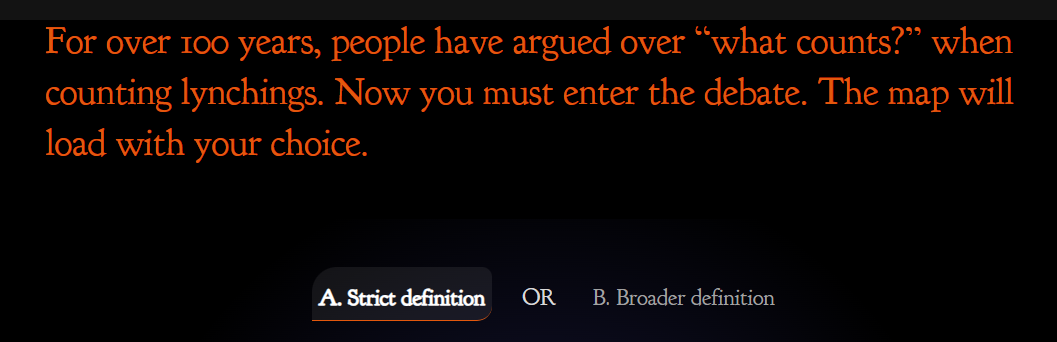
Intentionality goes beyond expected (though of course important) efforts to verify the accuracy of historical sources and identify any biases present therein [2]. Valid sources can be excluded or included based on one’s arguments or definitions, as highlighted by Hepworth and Church in their analysis of two visualizations of lynching in the United States [3]. Before a cartographic visualization is even accessible, the Monroe Work Today study compels the audience to pause and consider the effect of pre-conceptions on data collection and, by extension, the ultimate visualization and argument:
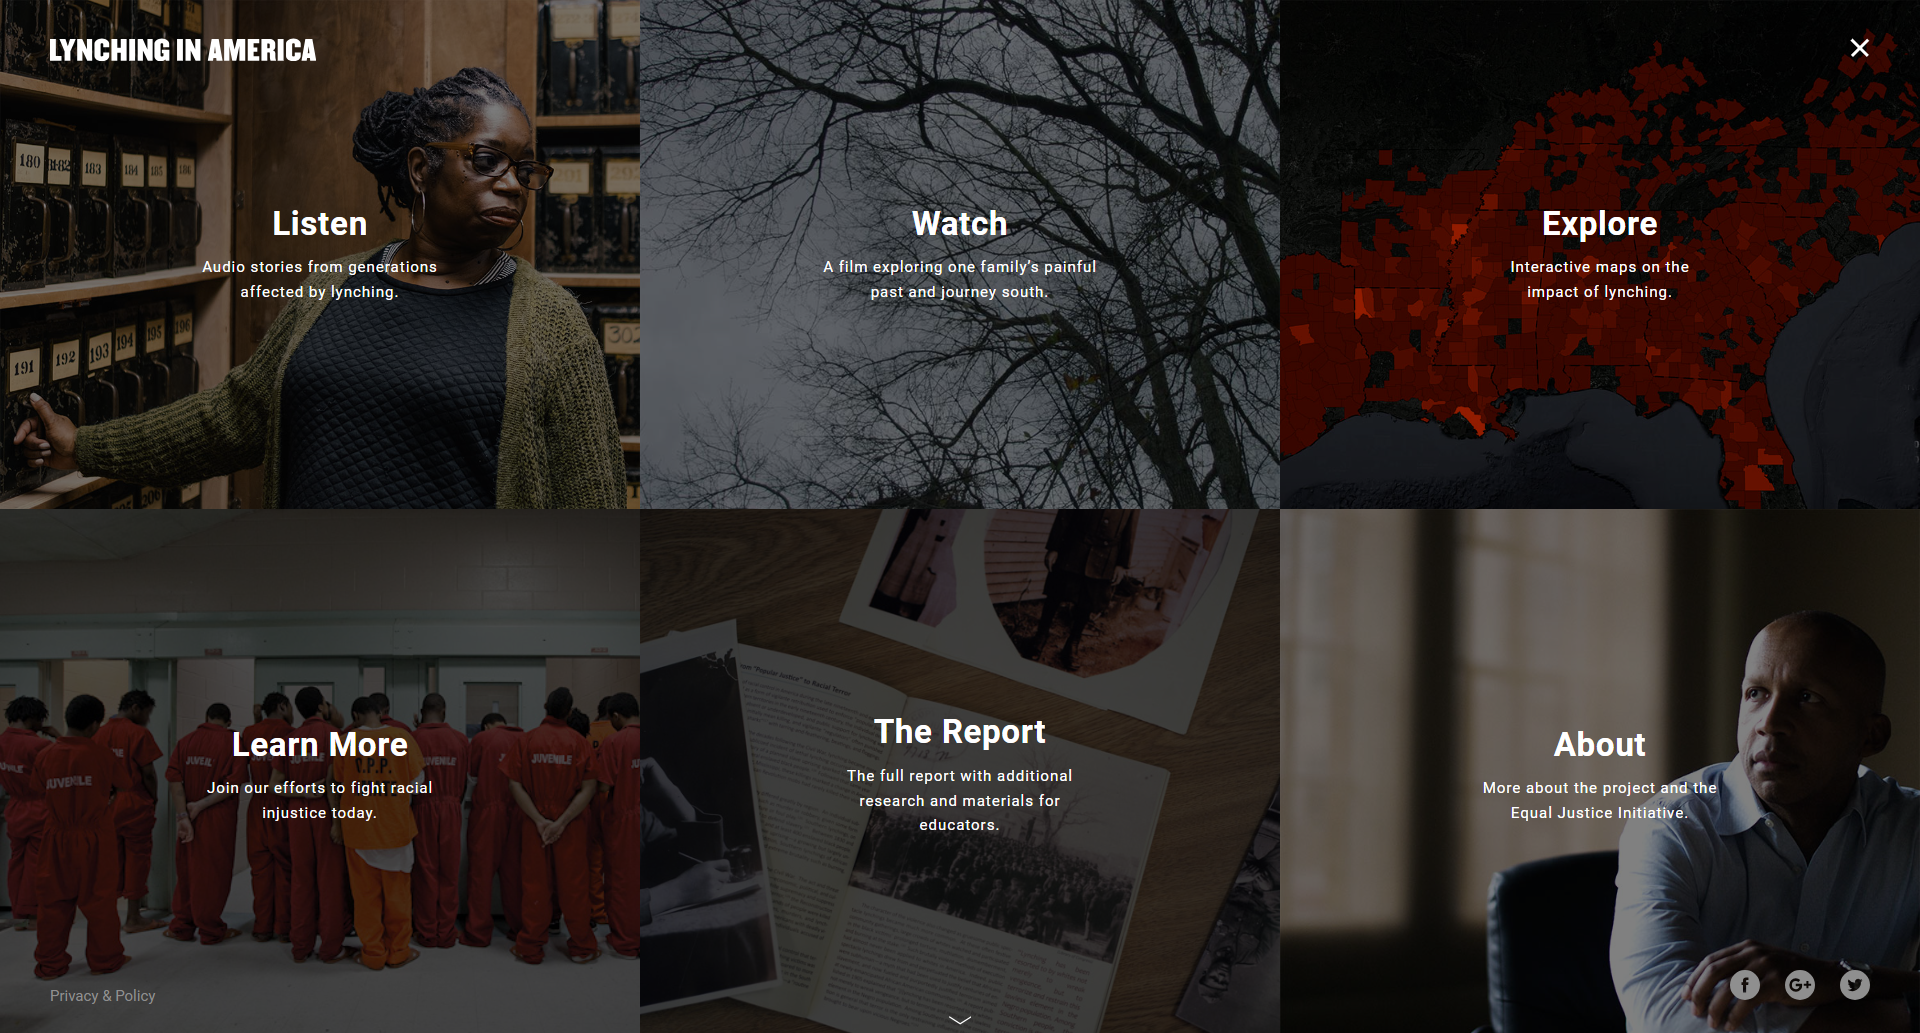
While the “Lynching in America” map by the Equal Justice Initiative and Google is accessible alongside multiple other resources, the assumptions or interests of the cartographers are not made readily apparent. Indeed, without the background provided by Hepworth and Church, I may not even have realized that EJI is actually using the historical and geographic argument to further the “organization’s present-day advocacy work regarding the inequitable mass incarceration of black Americans” [4].
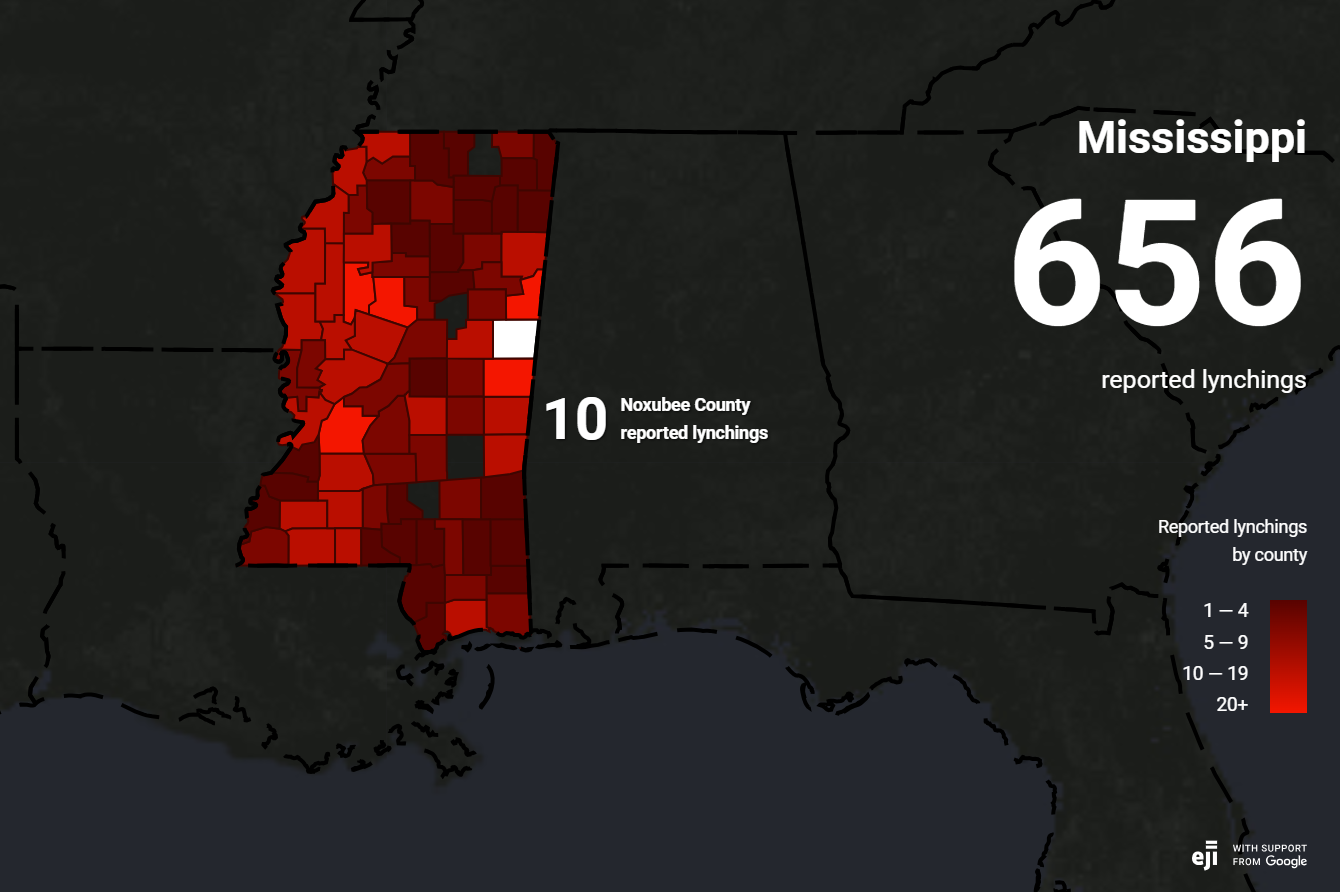
Regarding the mapping products themselves, the Monroe Work Today map once again prioritizes transparency of data. Unlike EJI, which maps lynching using county-level aggregation visualized with a choropleth, Monroe Work Today depicts each individual lynching as a point. Hovering on an EJI choropleth polygon reveals the number of lynchings which occurred in that county, but selecting a point on the Monroe Work Today map will prompt a description of the victim accompanied by links to sources and further reading.
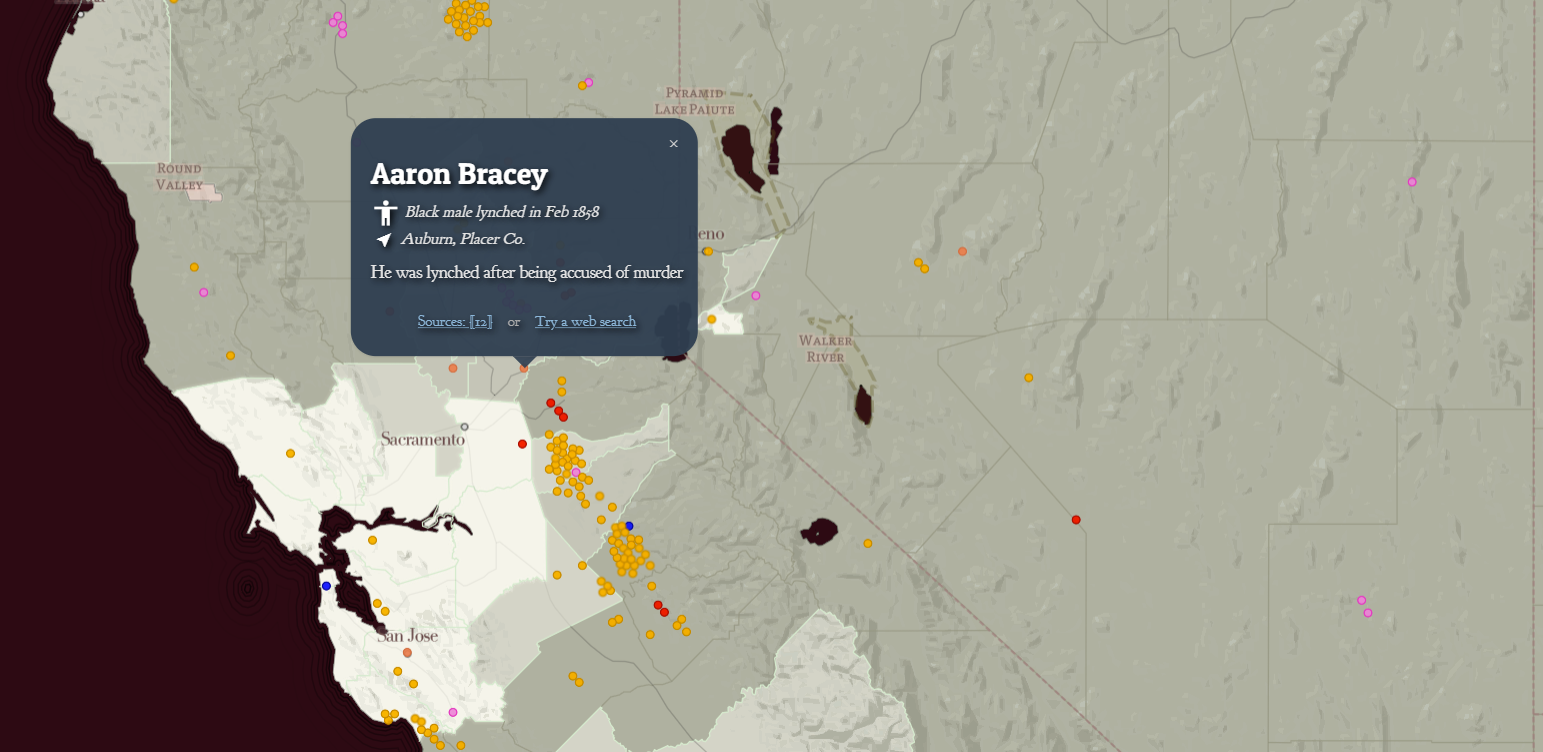
Hepworth and Church argue that the Monroe Work Today map, with its broader definition and individual points, paints a “more inclusive picture of white supremacist violence” [5]. The Monroe Work Today project is transparent about the data behind the cartography, and it presents that data in a way that acknowledges the individual humanity of lynching victims [6]. I agree with Hepworth and Church that the Monroe Work Today map is the preferred example of ethical mapping [7]. Maps should consider both those reading the map and those who are being mapped. While the EJI illustrates the horror of lynching in the aggregate, it does not readily include the audience in the data collection or analysis process. Moreover, as Hepworth and Church point out, presenting this sensitive and painful data in the aggregate can unintentionally dehumanize the subject [8].
Data collection and data depiction are inherent to all mapping, even with seemingly straightforward political maps which purport to show governmental boundaries (these rely on surveying, national claims to territory, etc.). As such, the most ethical maps are those which acknowledge data as a powerful, yet originally unshaped, tool. Cartographers should be transparent about data so that their work is open to full critique and replication. Any potential bias or interest that could affect data collection should be stated outright. Finally, the visualization of data should strive to be accessible to the audience, to do right by the subjects, and to be aware of the larger social and human context which might be impacted by the results of the project.
Research does not occur in a vacuum. Just as a scientist studying gene editing or artificial intelligence should consider the implications for human life, so should works of history and cartography consider that the narratives they create or support can have real influence on politics and culture. Historical study should of course be as objective as possible, but the way that objectivity is presented can make a difference. Visualizers must strive to be more than just transparent and accurate. They should also be aware that political actors lean on history to justify policy, and that the relationships between individuals and groups in the United States draw heavily upon the past. Moreover, they should be sensitive to the real stories, lives, and legacies with which they work.
Citation:
1 – 8: Katherine Hepworth and Christopher Church, “Racism in the Machine: Visualization Ethics in Digital Humanities Projects,” Digital Humanities Quarterly 12, no. 4 (2018).
Excellent blog and a fitting conclusion to blogs in this class. “cultural authority of definitiveness” – what a great way of thinking about the “power of maps!”