
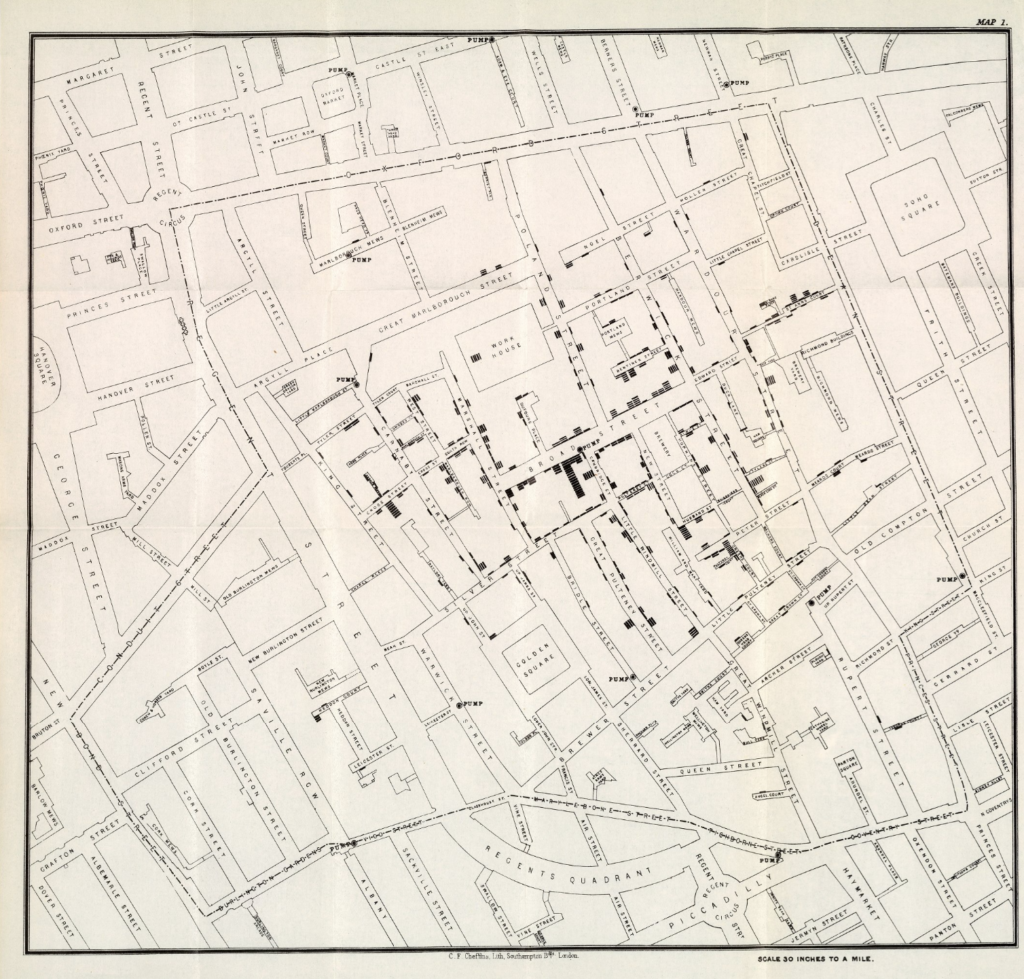
John Snow, On the Mode of Communication of Cholera, Map 1, 1855
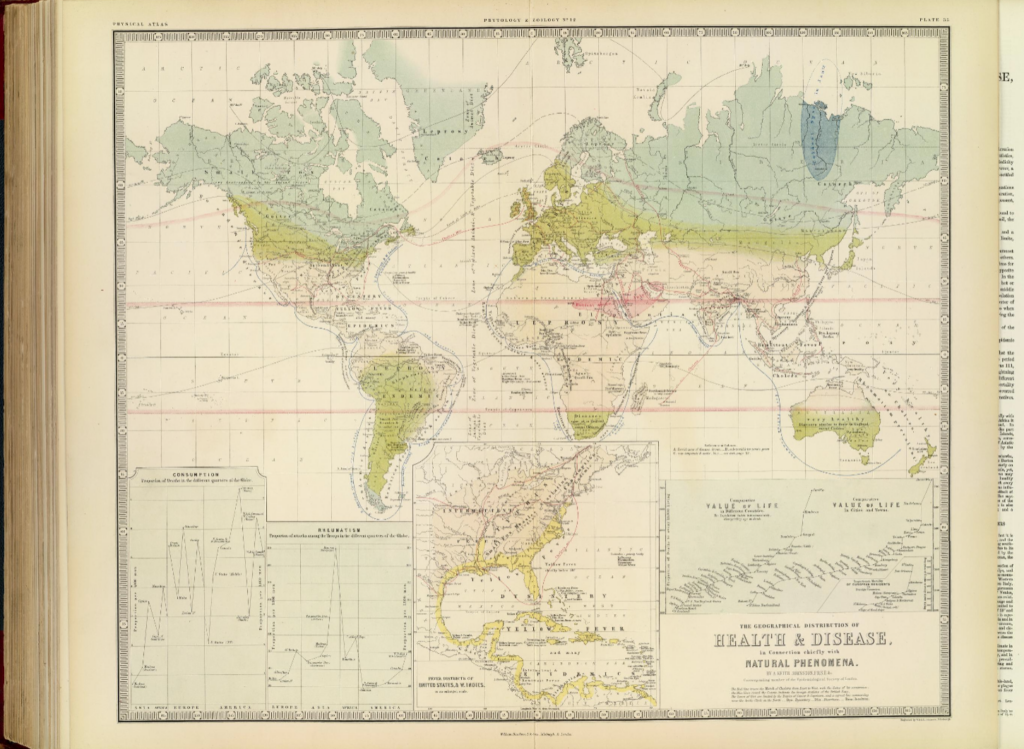
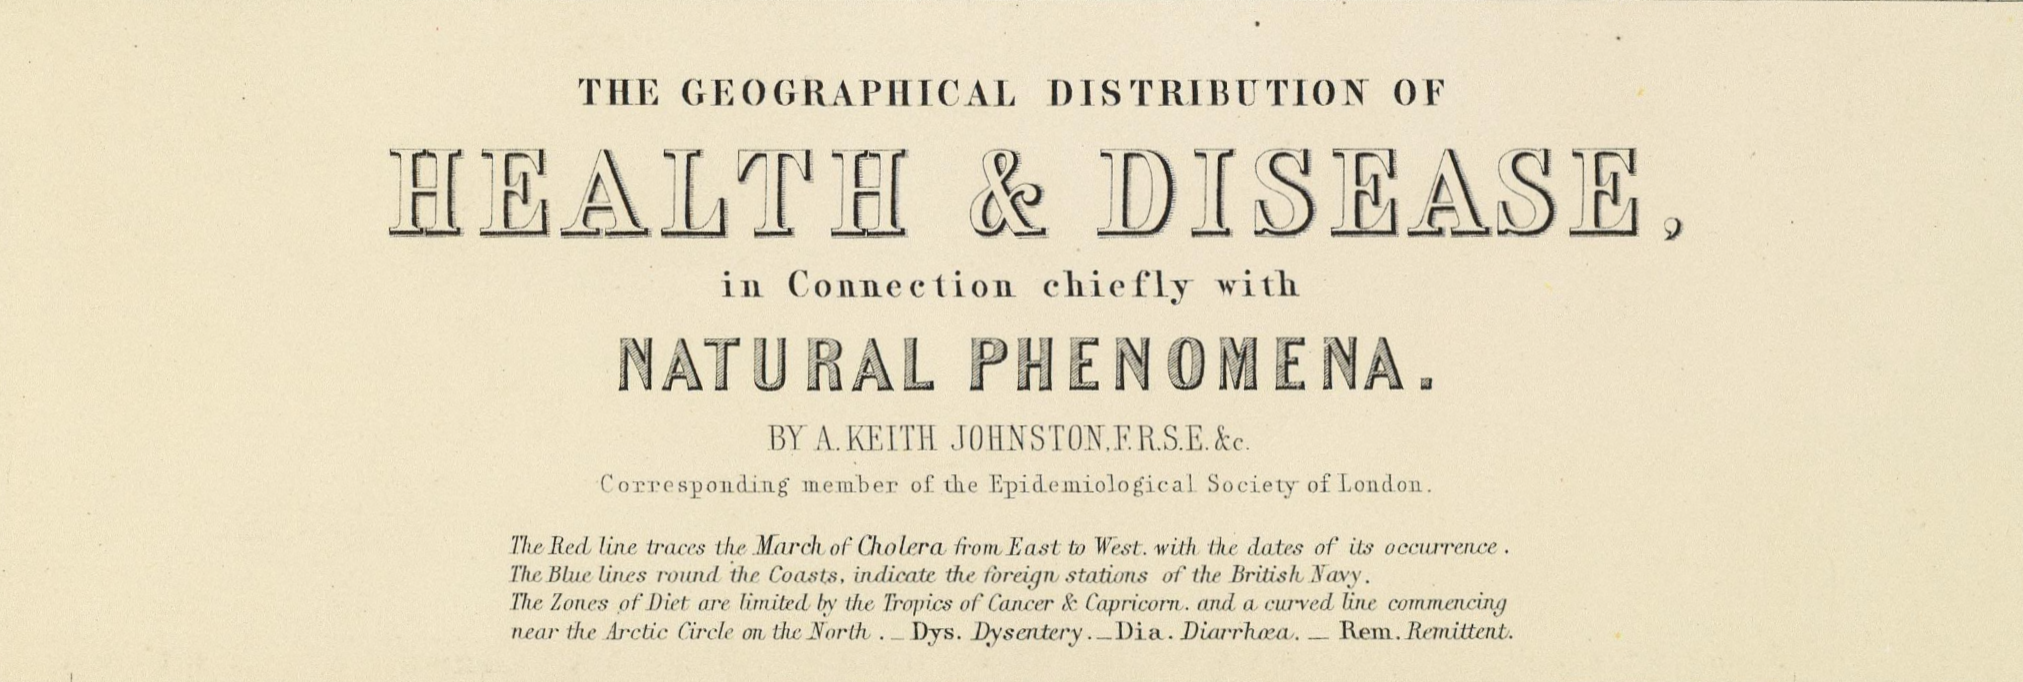
Alexander Johnston, The geographical distribution of health & disease, in connection chiefly with natural phenomena. (with) Fever districts of United States & W. Indies, on an enlarged scale, 1856
These two maps were created to express similar arguments, this being disease is connected to x. In John Snow’s case, the disease was cholera, and x was the pump on Broad Street. In Alexander Johnston’s case, the disease was consumption, rheumatism, yellow fever, dysentery, leprosy, typhus, &c. and x was their geographic location. While the structure of their arguments are the same, the subjects and the methods they used to present them lie on opposite ends of the same spectrum.
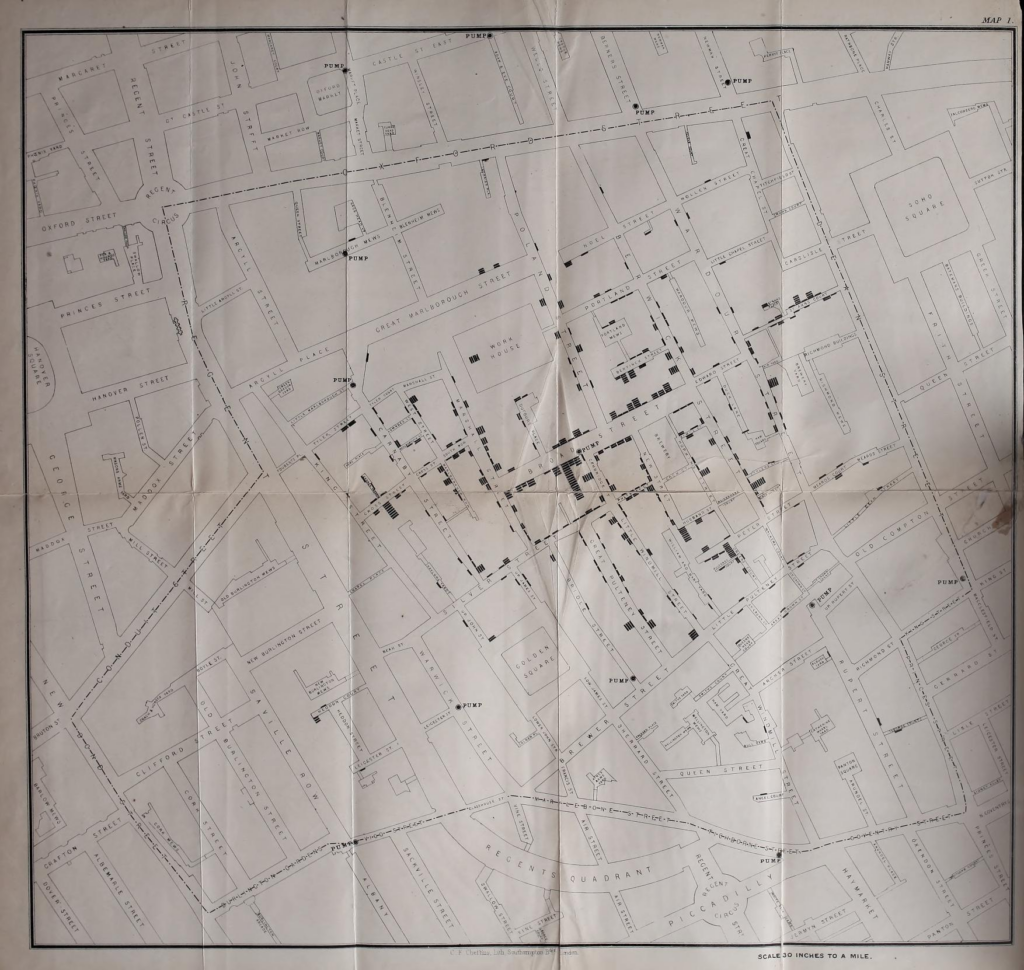
In 1855, John Snow published the 2nd Edition of On the Mode of Communication of Cholera. In this work, Snow included an enlarged map from his first edition with updated stats infamously known today as “John Snow’s Ghost Map”. “Map 1” served as a visualization of the locations of deaths by cholera and water pumps across the district of Soho, London. It was the first of its kind to display data like this and a straightforward aide in understanding the argument Snow made, that these deaths were somehow connected to the pumps.

When Snow’s research was published in 1855, it was unpopular. But before his research could fade into obscurity, Rev. Whitehead’s continued investigation into waterborne illness proved true with Map 1 being a major contributing factor. After this, variations of “Map 1” was reproduced for many publications such as the Report on the cholera outbreak in the Parish of St. James, Westminster, during the autumn of 1854 because of it’s straightforward visualization, catapulting it into fame and cementing Snow’s name in medical history.

The same might not be said for Alexander Johnston’s map. The Geographical distribution of Health & Disease, in Connection chiefly with Natural Phenomena was published in 1856. Its subject encompassed the entire world and every disease known to man within it at this time[kidding]. His goal was to map a correlation between the amount of deaths diseases caused and the climate of the region the disease impacted along with a varying number of other factors.
Johnston’s thematic map was hugely different from Snow’s reference map for many obvious reasons. A large component of this may be attributed to the enormous amount of information it depicts, from the statistical diagrams line the bottom of the page to the colors identifying the climates in different regions. Upon first glance, it is easy to compare Johnston’s map to the same fate Cooper’s map was described to have met in The Ghost Map reading.
” As exacting as Cooper’s map was, it ultimately had too much detail to make sense of the story… For a map to explain the true cause behind the Broad Street outbreak, it needed to show less, not more. “
– The Ghost Map, 193
While this statement was proven true when it came to the impact its complexity had on its re-printability and the ease of comprehension in it’s viewers, the global-encompassing nature of its subject made most of the maps additional information necessary to the argument.
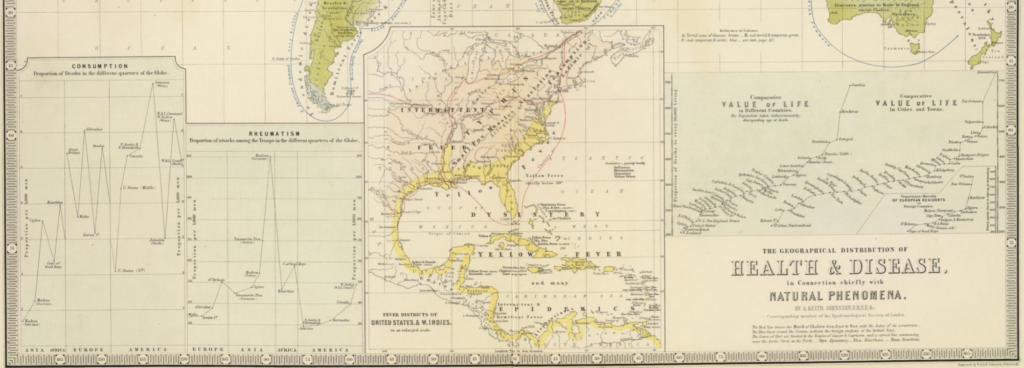
Since it’s creation, Johnston’s holistic approach to the creation of this map has been celebrated as one of the pioneering maps that connected the disciplines of cartography and epidemiology. While detailed to the point of exhaustion, the additional graphs worked well to express the impact the same disease had on different cities across the world and inspired following generations of cartographers to look for additional information to put on maps like this.
Alexander Johnston, "The geographical distribution of health & disease, in connection chiefly with natural phenomena. (with) Fever districts of United States & W. Indies, on an enlarged scale.", 1856
John Snow, "On the Mode of Communication of Cholera, 2nd Edition", 1855
Steven Johnson, "The Ghost Map", 2006
The Cholera Inquiry Committee, "Report on the cholera outbreak in the Parish of St. James, Westminster, during the autumn of 1854", 1855
Leah R. Keith
Nicely done Leah. Late, but well written and I love how you boiled down their core similarity to this succinct phrase: “These two maps were created to express similar arguments, this being disease is connected to x.” Indeed!