Stage 6- Marie Amelse to Evan Murphy

This storymap was on futbol/soccer stadiums in the United States and how different things impact their creation and continued use. The story map not only explains the locations of the stadiums but also different leagues that have existed in the country, and still do today such as the MLS, NSWL, and the USL. The map also included how these different leagues also would share geographical spaces, or in other cases be more spread out. In addition the story map explains United States culture around futbol but also how it fits into futbol culture around the world.

The use of several different maps to show physical location, change over time, and comparison was one of this maps strengths. In addition the way in which the story map told the story was a large assets The story of culture intertwined with organization is something that can not always be told linearly, but this story map did a great job of including enough information in the right sections, in a way that was not overwhelming. Another thing that was very impressive about this map was the use of different medias- images, timelines, even a video.

This map had many strengths and I felt it was a very effective story map, my only critique is that it might have been beneficial to use different types of maps, along with the maps that showed the physical locations of the stadiums. I enjoyed how culture was tied into so it might have been interesting to have seen a map to represent that in some way.

This story map is an excellent example of how storytelling and maps can work well in complimenting each other to show a more complete story.

Stage 3- Marie Amelse

  1. Board of State Capitol Commissioners. First Biennial Report. St. Paul, Minnesota: The Pioneer Press Company, 1895.  https://www.lrl.mn.gov/docs/2009/other/090717.pdf

The Biennial Reports were created to inform the Governor ( and general public) about the progress of the development of the building. Included in them are costs, general issues that had been faced over the past year or so, who they decided to extend contracts to, etc. Also included in them are summaries written by the building architect, Cass Gilbert.

 See above.

See above.

  • Board of State Capitol Commissioners. Butler Bros. Interior Woodwork. Minnesota Historical Society. March 1902-Novemeber 1905.

This is a contract between Butler Brothers and the State Commission on the goods and services expected, as well as the costs.

  • Butler Bros., Dome Construction Contract. Minnesota Historical Society. 1900-1902.

This is the contract between Butler Brothers and the State Capitol Commissioners for the dome. They had also won the bid for the dome over many other suppliers. The dome is  self-supporting marble dome and was a feat to construct. This contract includes expected services and goods as well as the cost for this specific job.

  • Butler Bros., Interior Stone and Marble Contract. Minnesota Historical Society. October 1902 – February 1905.

This is the contract between Butler Brothers and the State Capitol Commission on the price of the stone and the services that are expected

  • Contract with Cass Gilbert. Minnesota. Board of State Capitol Commissioners. Records. Minnesota Historical Society. 1896, 1898, 1901.

This is the contract between Cass Gilbert, the head architect and the State Capitol Commissioners. Cass Gilbert had won the bid for the position, above several other renowned architects.

  • Gilbert, Cass. “Specifications for the New Minnesota State Capitol Building, St Paul Minnesota.” Minnesota Historical Society, Capitol Site. 1897-1903.  

These are summaries or details taken down by head architect Cass Gilbert. He had much artistic freedom and made changes on several occasions, these are notes on some details of the deals done for the building.

  • Minnesota Legislation Committee on Public Accounts and Expenditures.  Report of the Investigation of the Capitol Commission by the Committee on Public Accounts and Expenditures. St. Paul, Minnesota: Mcgill-Warner Co., 1903.

An investigation on how taxpayers money was used in the expenses within the building of the Capitol. They conduct an examination of how prices were came to in the buying of goods, services, and the land that it was built on

Plastering: Contracts and Other Materials. Board of State Capitol Commissioners. Records. Minnesota Historical Society. 1902-1905

    These are contacts with several suppliers and companies that were plastering throughout the building, including the statues.

    Secondary

    1. Blodgett, Geoffrey. “Cass Gilbert, Architect: Conservative at Bay.” The Journal of American History 72, no. 3 (1985): 615–36. https://www.jstor.org/stable/pdf/1904306.pdf?refreqid=fastly-default%3Aaaa0d166a310121435a12b3724828bc9&ab_segments=&origin=&initiator=&acceptTC=1 .

    This is a journal article about Cass Gilbert and who he was a as a person, it can help add context to the decisions he made when over seeing the construction and planning processes.

    • Board of State Capitol Commissioners. “Photograph Album.” Minnesota Historical Society. May 1896-November 1905.

    This is a photo album of pictures taken for the documentation of the building process. It includes photographs of workers, architects, before, after, and progress images of the construction. It also includes photos from quarries where stone was sourced from.

    This is essentially a digital tour of the state capitol as it looked 10 years ago before the 2017 restoration. It was put out by the city of St. Paul.

    • Gauthiere, Julie. The Minnesota Capitol: Official Guide and History. St. Paul, Minnesota: Pioneer Press, 1907. This was contemporary book created to explain the newly constructed building. It has many photographs, and the authors own commentary on the techniques used on every level from management of the workers to the aesthetics of the final project.
    • Labor Education Service, University of Minnesota. “Who Built Our Capitol?” Accessed 3/24/2024. https://www.whobuiltourcapitol.org/offsite-industries (

    This was a website with information such as the workers who helped built the capitol building, the sourcing of materials, construction techniques used etc. It is a bottom-up approach telling of the creation of the building.

    This is an extremely detailed informational with photographs of where the different stone is used in the capitol today, it also includes many explamations and who the contactors were.

    Website page written on the general history of the building with an emphasis on Cass Gilberts decisions and later on, why a restoration was necessary.

    • O’Sullivan, Thomas. North Star Statehouse: An Armchair Guide to the Minnesota State Capitol. St. Paul, Minnesota: Pogo Press, 1995.

    This is a broad overview of the history of the building, it includes some information on the sourcing of materials, but mostly focuses on politicians of the turn of the 20th century  and the legacy of the building.

    • Thompson, Neil. Minnesota’s State Capitol: The Art and Politics of a Public Building. St. Paul, Minnesota: Minneosta Historical Society Press, 2005.

    This is a book that sets much of the social and politics of why the building looks the way that it does. It includes some dealings with artists and contractors, but mostly focus’ on the social context of the art and architecture of the building.  

    1. Whitenack, Paul, L. Brad Shotwell, and Michael J. Scheffler. “Georgia Marble Repair at the Minnesota State Capitol.” APT Bulletin: The Journal of Preservation Technology 46, no. 4 (2015): 10–17. http://www.jstor.org/stable/43659959.

    This is actually about the restoration of the Georgia marble, but it focus’ on the sourcing of the where the original marble came form because the restoration commission wanted to source as close as possible to the original material.

    Mapping Ethics Blog post- Marie Amelse

    When reading and exploring the Equal Justice Initiative and then the Monroe & Florence Work Today websites they at first seem to be relaying the same message, with varying different minor details and framings, however “Racism in the Machine” Hepworth and Church do a great job on contrasting these two different visualizations and representations of racial violence from the dawn of the civil war onward. At first they do not seem that different from each other, but after digesting both and especially after also reading from Hepworths and Church’s analysis, you can see how stark the differences really are. In the end they presented and even chose data in different ways even when seemingly portraying the same idea.

    Monroe & Florence Work were especially aware of sourcing and defining their data, and it is clear the current website also shares this sentiment. The Work’s were very deliberate in searching for the validity of lynchings, as a result this website is honest in communicating that their database is likely underreporting the incidents of lynching. The Work Today website also includes education information on different definitions of lynching.

    Here, this window shows an option to show both a “Strict definition” and a “Broader definition”. Even within their website there is transparency that the same message end up looking very different based on definitions the statistics revolve around.

    On the other hand the Equal Justice Initiative ( EJI) is not as clear on the definitions of what the graphs and statistics show. Although it is clear that the numbers focus on the deep south. Below is one of the main slides on the Lynching in America webpage. Interestingly in span of time which spanned over 70 years there was only “2 reported” lynchings in California and “1 reported” lynchings in Michigan. This contrasts with the data from the Work website which reports 26 for both states in that same time range under the “Broader definition”.

    Above, is the Lynching map shown on the EJI website. As Hepworth and Church, the EJI has a strong emphasis on the deep south, almost portraying racism as clustered and almost solely being perpetrated in the South. Below is is a 100 year span from the Work website, which presents the continental US all together, and while the mob violence is concentrated in the South, it is shown to be an issue that is present throughout the U.S.

    Another thing that was a variable that Hepworth and Church presented was even who these different data bases considered who lynchings could be perpetrated against. The Work Today website made it clear it was a racially motivated crime that could be committed by white mobs against any racial minority, EJI on the other hand sole focused on lynchings against African Americans. Can this mitigate historical violence against Native Americans, Asian-Americans, or other racial minorities? In this case it is especially important to take into account the larger goals of who creates these data sets. EJI, for instance is focused on fighting mass incarceration, and especially fight the inequality against Black Americans within the criminal justice system. The publisher of the Monroe & Florence Work Today website is #PlainTalkHistory, whose focus is to tell the multicultural and multiracial history of the US that can too oftenly be ignored in popular US history lessons. Knowing these things on the creators can add more context to the maps and messages they create.

    Stage 2- Marie Amelse

    My project is going to be based around the building of the third, and last state capitol of Minnesota. The capitol is located on Martin Luther King Jr Blvd in Saint Paul, MN. It was built in between 1896-1904 and officially opened to the public on January 2nd 1905, therefore most of the scope of my project will take place within those years. I will specifically looking at the sources of the main materials, as well as where the contracting companies are located. These, along with the location of the capitol building will create a three-layered map.

    As for my source material, a large amount will come from historical data and primary written sources. The Minnesota Historical Society still holds the many of the correspondence and contracts that were utilized for materials during this time. Additionally, during the build phase they had something called a Board of State Capitol Commissioners where the building committee would essentially release reviews of what was happening over the past 9 months or so. There are also several historical narratives written about this project and I feel like these would also be good sources.

    I think the best way to present my final project would either be a story map or a static map showing the connection of different locations of the Capitol building along with where the materials were sourced and where the contracting companies are located. If I was to do a static map I think it would be very important to also include small bits of historical contexts for each additional location of contractors or material sources.

    The capitol is a treasured building with a rich history, this was a project with sources and communications spanning several different states, and even countries. Researching the inter-connectedness of it can bring a new layer of awareness to the spatial relationships of the day and how, or if distance impacted the communication and efficiency of the project.

    The Dust Bowl and ArcGIS- Marie Amelse

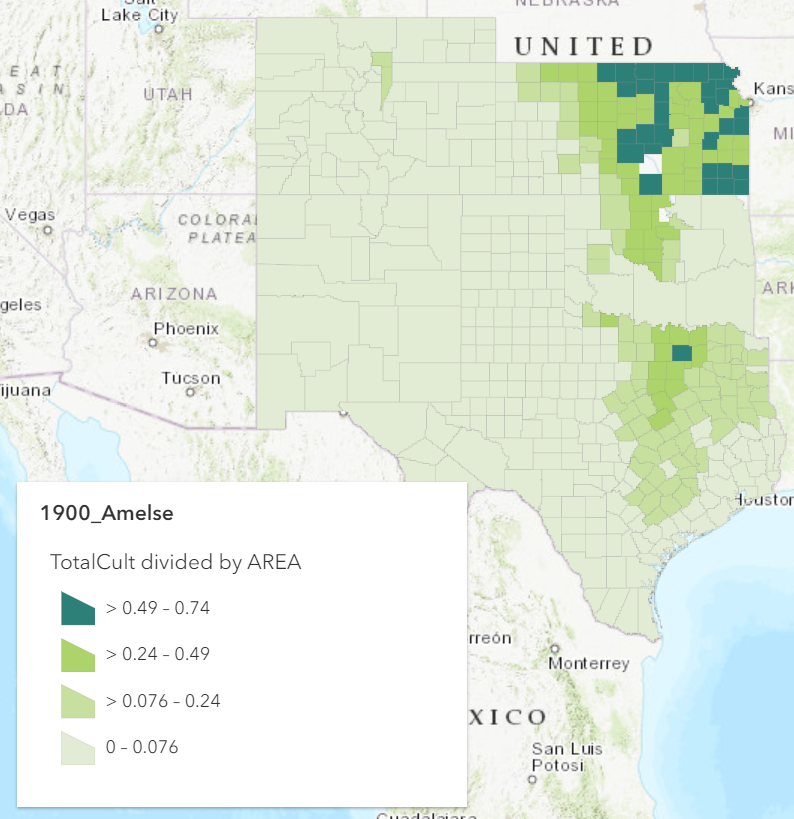
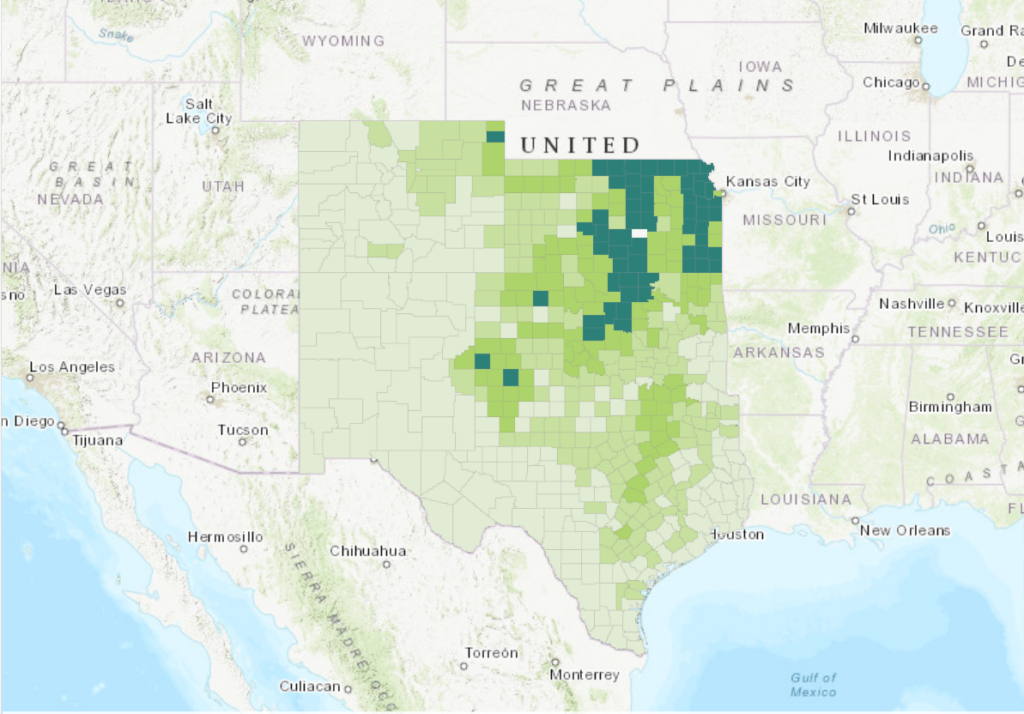
    The most obvious key changes that I noticed was how they started collecting the data for Oklahoma in 1900. From no data to using data and splitting the state into counties supplies a contrast in the images. An important detail I noticed was the differences in how the classes of percents are split up. It gets larger in the transition from 1880, but then decreases again in the transition to 1940 it decreases again. I wonder what the maps would look like if the breaks were standardized through the years. Aside from that, another key change I noted was how the cultivation spread, especially towards the west as the decases went on. New ground was being cultivated in subsequent years.

    Blog Post 9- Marie Amelse

    In 1872 the Great Plains was opened by the U.S government for public domain homesteading. This really marked the beginning of a vast transition of land to more cropland, then less cropland, then more again in a push and pull that marked the Great Plains for the next 100 years. 

    This a snapshot of wheat bushel production in the year 1900. This map was created by Henry Garrett, where the darker the color means the greater the wheat production was in that area. It is important to note that while the same scheme would persist after the initial plowing, their county production year to year or decade to decade would vary all across the Plains, this could be due to rainfall for that year or if farmers in that area simply sowed less that specific year. Garrett created a simple map to follow, with little more than the reference information necessary in order to recognize the message of the map. 

    On the other hand, Geoff Cunfers figures from “Pastures and Plows,” on the Great Plains shows this gradual change over time of land usage shifting to and from pastures and cropland.

    Even by the last agricultural census taken in 1991 there was still a significant amount of grassland on the Great Plains. Even with the huge advancements in the previously 150 years, there is still significant “untamed” grasslands in the Great Plains.

    Cunfer, Geoff. “Pastures and Plows.” In On the Great Plains: Agriculture and Environment. Texas A&M University Press, 2005.

    Gannett, Henry. Production of Wheat Per Square Mile at the Twelfth Census 1900. U.S. Census Office, 1903.

    Heat maps and Voronoi Polygons- Marie Amelse

    Aside from mortality data during an epidemic, can you think of any other situations where a heat map or Voronoi polygons would be useful ways to analyze spatial data? How might they be useful in this context of your final project (if at all)?

    One things that comes to mind when I think about heat maps especially, is the production of Carbon Dioxide emission its relationship to large cities. I think it is a simple way to view CO2 emissions and why they are most concentrated. As for Voronoi polygons it could be useful in the context of nearest grocery stores, it would be interesting to see how often people use the closest grocery stores to them, but also in relation to food deserts and how far it could be that a person would need to travel to even one source of affordable, fresh food.

    I do think that heat maps, more so than Voroni polygons might be useful for my final project to relate where there is higher rates of health insurnace, althought that might make it overwheleming to view if the entire map is more or less encompassed by the heat map.

    css.php