
- Levi’s map argues that the Great Migration impacted Denver’s North Point Neighborhood by the number of Black people that increasingly moved into the neighborhood. Levi shows census data that shows the increasing number of Black people within Denver’s North Point and also new buildings such as a YMCA.
- I really liked how thorough the data was that they collected for their map. The number of maps included also really adds to the argument. There are a multiple number of maps throughout the storymap that add to the story and they’re all super well done. All of the maps are really organized.
- I think for Levi’s storymap I would have considered writing more text. This could just be because I love to talk and tell stories, but I think that element could have been used a bit more, especially to add on to the story of the maps. I wish there was more background on the Great Migration and specifically how segregation spread throughout Colorado. I feel as if the HOLC is briefly touched on, but I wish I knew more about how it was Colorado and Four Points specific. I also wished there was more about the culture of the neighborhood, knowing that famous jazz musicians were from the neighborhood. I think all of the claims are fully supported, however, and that is done very well with maps to back them up.
Stage 5- Final Draft
Stage 4 – Draft of Final Project
Emily Gaddy- Annotated Bib
Secondary Sources Bednarek Janet R. Daly. The Changing Image of the City : Planning for Downtown Omaha 1945-1973. Lincoln: University of Nebraska Press, 1992. Showcases Omaha’s City Planning and the planning of different highways throughout the metro area. There is few on the North Freeway itself, but it is interesting and helpful to see the other roads surrounding the construction of the Freeway, as they also cut through different minority communities. Hillier, A. E.. “Redlining and the Home Owners’ Loan Corporation.” Journal of Urban History. 29, no. 4 (2003): 394-420. https://doi.org/10.1177/0096144203029004002. This source is helpful in understanding the effect of the HOLC on American cities. The HOLC’s grip on American society and the creation of redlining is great for context to inform my understanding of types of segregation. Karas, David Patrick. “Highway to Inequity: The Disparate Impact of the Interstate Highway System on Poor and Minority Communities in American Cities.” New Visions for Public Affairs. 7, (2015). Karas highlights the disparities between communities of color and their disproportionate number of road systems, compared to wealthier, white neighborhoods who have little highways, noise pollutants, and cars compared to their black counterparts. Leiker, James. “Challenging the Color Line in Kansas and Nebraska/The Revolution at a Regional Nexus.” In Black Americans and the Civil Rights Movement in the West, edited by Bruce A. Glasrud and Cary D. Wintz. Oklahoma: University of Oklahoma Press, 2019. This helps lay the historical groundwork for segregation and racism in Midwestern cities. This specifically mentions Nebraska’s history of racism and racial violence. This has less to do with the road systems, but cultural context. McNichol, Dan. The Roads that Built America: The Incredible Story of the U.S. Interstate System. New York: Sterling, 2006. This lays the groundwork for Einsenhower’s expansion of America’s interstates. This also speaks of how these were funded, either through state grants or the federal government. This puts the highways into context, specifically in the rise of white suburbia and the burgeoning need for highways to transport white people to their homes created during White Flight. Mohl, Raymond A. “The Interstates and the Cities: The U.S. Department of Transportation and the Freeway Revolt, 1966–1973.” Journal of Policy History. 20, no. 2 (2008): 193–226. https://doi.org/10.1353/jph.0.0014. Mohl speaks of divisions created by the U.S. highways and how they affected poor communities and communities of color. This also talks about city suits and other lawsuits put forth against highway building and how most of them failed. Omaha Public Schools. “Making Invisible Histories Visible Collection.” University of Nebraska Omaha Archive and Special Collections. University of Nebraska at Omaha Libraries. https://archives.nebraska.edu/repositories/4/resources/3602. OPS did a project on redlining specifically in Omaha. There are a few references to HOLC and the North Freeway. OPS also acknowledges their part in redlining Omaha and lack of access to resources in North Omaha. Sasse, Adam. “A History of Redlining in Omaha.” North Omaha History, August 2, 2015. https://northomahahistory.com/2015/08/02/a-history-of-red-lining-in-north-omaha/ Adam Sasse is a great resource for Omaha history, specifically North Omaha. Sasse works in tandem with the Omaha Public Library and Black Plains History Museum. This particular article goes into detail on how redlining specifically affected North Omaha and South Omaha, mentioning the HOLC. Sasse, Adam. “History of the North Freeway in Omaha.” North Omaha History, December 3, 2023.https://northomahahistory.com/2020/10/28/history-of-the-north-freeway-in-omaha/comment-page-1/. Again, Adam Sasse creates great articles on Omaha history. This one is the most comprehensive history I could find on the North Omaha Freeway. It lays out the planning of it, the reactions and protests, the demolition of multiple community buildings, and the demographics of the areas destroyed by the North Freeway. Strand, Pamela Joy. “‘Mirror, Mirror, on the Wall…’: Reflections on Fairness and Housing in the Omaha-Council Bluffs Region.” Creighton Law Review. 50, no. 183 (March 1, 2017). https://www.openskypolicy.org/wp-content/uploads/2020/10/StrandRedlining.pdf. Stand, a Professor of Law at Creighton, reflects on Omaha redlining and the power of maps on a community. She goes into detail on socioeconomic and racial segregation seen within Omaha and Council Bluffs and the resources anointed to different populations throughout the cities. Primary SourcesBlack Populations, 1960. nhgis.org, (based on data from U.S. Census Bureau; accessed April 1, 2024). The 1960s were the period in which White Flight was at an all-time high. More black people started to move into North Omaha during this period and built/moved into black suburban neighborhoods. The black middle class was created during this period, most of these neighborhoods clustered around what would later become the area of the North Freeway. This is the decade Eisenhower passed his Highway and Interstate Act and the decade Omaha started planning the North Freeway. Black Populations, 1970. nhgis.org (based on data from U.S. Census Bureau; accessed April 1, 2024). The 1970s saw North Omaha’s demographics become less and less diverse, with most white people having left and the population consisting mostly of Black Americans. This decade saw the construction of the highway begin and civil suits followed from those in the North Omaha community. Black Populations, 1980. nhgis.org (based on data from U.S. Census Bureau; accessed April 1, 2024). This is the decade that the North Freeway was completed. This shows the population density surrounding the Freeway and the new, stricter segregation of Omaha’s quadrants of North, South, East, and West. City of Omaha, Nebraska, Nebraska Department of Roads, and US Department of Transportation Federal Highway Administration. North Freeway Corridor Study/Lake Street to Interstate 680/Omaha, Nebraska. Henningson, Durham, and Richardson, Inc. June 1975. https://govdocs.nebraska.gov/epubs/R6000/B002.0014-1975.pdf. Overall, this is the best resource I have found. This was a study done from the City of Omaha in collaboration with the US Department of Transportation. Within this study there are multiple maps of the city before the Freeway, along with community landmarks that were destroyed. There is also a study of the cultural reaction of the city, the suits that followed construction, and the impact of the Freeway on the community. It is very thorough. Johnson, Lerlean. 1982. Interview by Alonzo Smith. August 25, 1982. Interview MSS-0130, audio, University of Nebraska Omaha Archives and Special Collections, University of Nebraska at Omaha Libraries. University of North Omaha conducted a project to preserve Black Omaha history. Part of this project was their Oral History collection of interviews from Black people all over Omaha. In Lerlean Johnson’s interview he speaks of the North Freeway and how he was one of the people who filed a suit against the city and also protested the construction of the Freeway. Love Jr., Preston. “North Omaha Begins a New Chapter.” Omaha World Herald, July 7, 2022. https://omaha.com/opinion/columnists/column-north-omaha-begins-a-new-chapter/Article_7ead2720-fedb-11ec-a322-83c29e49a99a.html. Preston Love Jr. writes about North Omaha trying to reconcile themselves with the rest of the city after the traumas inflicted and segregation. Impoverished Population, 1960. nghis.org, (based on data from U.S. Census Bureau; accessed April 3, 2024). In 1960, North Omaha, specifically the area around the freeway was not as impoverished as it was later on, but still held a large portion of Omaha’s poorer citizens. This is the decade the idea of the Freeway started development. Impoverished Population, 1970. nghis.org, (based on data from U.S. Census Bureau; accessed April 3, 2024). Richer citizens left during periods of White Flight and during the start of construction of the North Freeway through their neighborhoods in the 1970s. Impoverished Population, 1980. nghis.org, (based on data from U.S. Census Bureau; accessed April 3, 2024). In the 80s, the Freeway was complete and North Omaha was split in half and cut off from the city. This helps to see the rates of poverty increase as the decades went on. Omaha, Nebraska Roads, 2005. dogis.org, (based on data from City planning records; accessed April 2, 2024). Douglas Ct. QGIS has a database of all the roads within the city that I’m able to download as a shapefile. This shows the North Freeway within the city and helps visualize the road. Wirt, Landon and Austin Knippelmeir. “A Freeway Splits and Omaha Neighborhood.” Omaha World Herald, December 18, 2022. https://omaha.com/a-freeway-splits-an-omaha-neighborhood/article_9817cad0-7ce9-11ed-806d-735ceb03ad97.html
(I would like to also mention NOISE Omaha, which has a huge list of resources for redlining including many static maps: https://www.noiseomaha.com/resources/2019/7/12/redlining-resources. Also, Adam Sasse and the Freeway Study have multiple maps throughout the readings, specific to Omaha. These show the old businesses, schools, and other community centers destroyed. The Freeway Study has been a detrimental resource during my research, especially considering both the cultural context and the sheer number of maps and data strewn throughout the document.)
Ethical Implications of Mapping History – Emily Gaddy
Growing up in what is colloquially called the “Dirty South,” there is an expectation of stupidity and racism associated with Southerners, especially those from the Dirty South. There is the misconception that we tote around shirts with “THE SOUTH WILL RISE AGAIN” in bold letters amidst the backdrop of the Confederate flag. Our accents are seen as hillbilly (especially in Appalachia) and there is no regard to the rich culture and there is no mention of black Southerners unless it is in regards to slavery or acts of racial violence. These stereotypes are not only rooted in racism, but also classism (often ignored in the United States). Only recently, with Georgia (my home state) becoming a swing state, are there more talks around political disenfranchisement in terms of voter suppression and the realization that a lot of Southern voices have been stifled by the (often) loud, far-right populations of those states. I credit Stacey Abrams for finally opening the floor up to conversations about modern-day voter suppression of black voices.
In digital mapping, there is a reliance on human-made algorithms and the whims of the mapmaker themself. The article we read used the example of the Twitter-made, AI, Taytweets, which used people’s Tweets to learn how to communicate less like AI and more like an actual person. Of course, humans are not infallible, and the computer coders that create AI are not neutral, so, as the articles states:

And that:

“Racism in the Machine: Visualization Ethics in Digital Humanities Projects”
It makes sense that misconceptions and stereotypes about differing geopolitical states would be prevalent in mapping and geographical history projects. The maps we used for this blog post show the same subjects, but in contrasting ways.
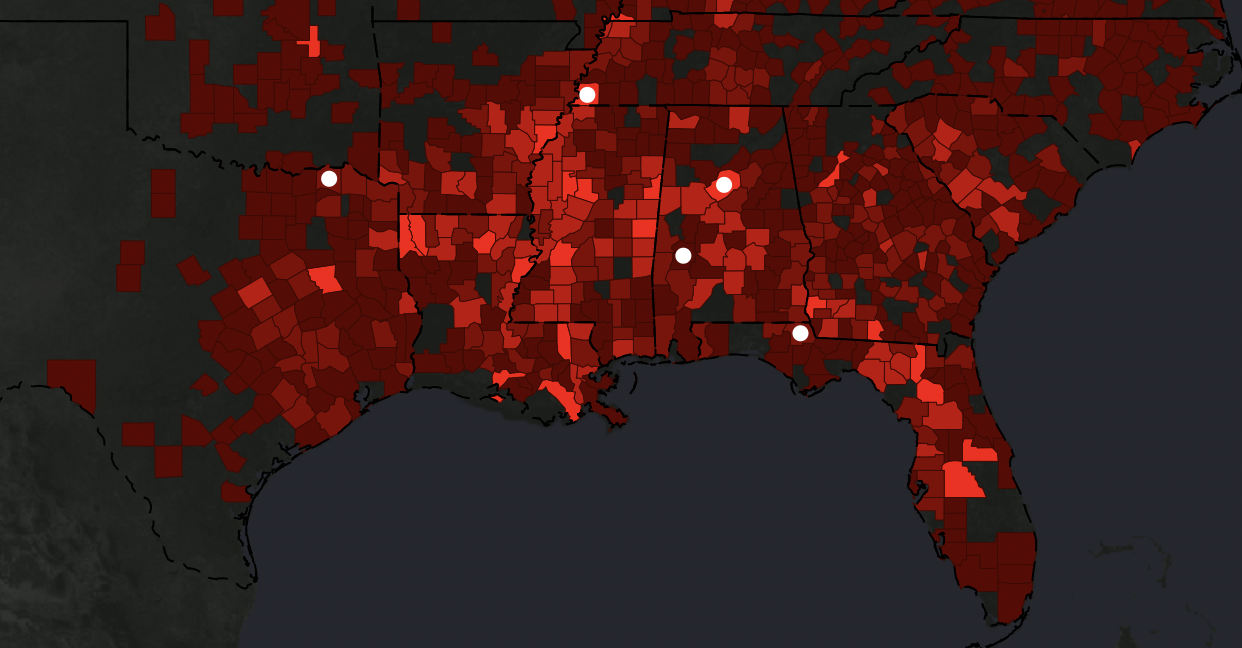
(Lynching in America, EJI and Google).
This map, made with a partnership with Google and EJI (the Equal Justice Initiative), focuses almost entirely on the state of racial violence in the Deep South. We’ve spoken in class about how maps tell stories and this one recirculates the stereotype of racial violence and racism being an act mostly committed in the South. While a majority of black lynchings did take place in the South, it is also important to note that that is because a higher concentration of Black people lived in the South than the North.
“Visualizing data that exclusively focuses on the African-American experience in the Southern United States provides an important argument about the nature of Jim Crow racism. However, purporting such data to be an inclusive representation constitutes a harm in the sense that it perpetuates common narratives of racial violence as a southern exception to an otherwise inclusive nation.“
“Racism in the Machine”
This shapes the systematic oppression and structure of white supremacy as being something linear- of power birthed from the top and trickled down to the bottom percent of people within white hegemony. White supremacy is not, pun intended, black and white. Racial violence, while extremely horrific is not the full story of white supremacists and their maltreatment and persecution of other racial and ethnic groups. Racial violence is usually the escalation of decades of whites being able to get-by with “smaller” crimes and abuses:
“The conflation of lynching with the full extent of racialized violence in United States history obscures the historic depth and breadth of the oppression of people of color. A black individual was far more likely to suffer public humiliation, assault, rape, and murder than a public lynching.“
“Racism in the Machine.”
I understand the reason why the mapmakers chose lynching, however, it is a physical and tangible manifestation of racial violence. The stories of black people being raped or abused are far too commonplace, so therefore there are few records documenting the crimes. However, white supremacy thrives not just on murderers and extremist groups like the Aryan Brotherhood, but on the complacency and the actions of everyday white people, who use “not me” statements and ignore the white supremacists tendencies that are conditioned into the white American populous through years of American historical propaganda and nationalism, regardless of geographic region or state. I lived in Southwest Missouri for a bit and I was surprised by how prevalent the Klan was there. I knew someone whose grandfather was a founding member of the Klan in Southwest Missouri. One day when I was cleaning out a closet in their home, I found their grandfather’s bloodstained Klans robes. It was terrifying- to see the ghostly manifestation of the United States racist terrorism in person.
The other map, made by Monroe Work, showcases more nuances in white supremacy, showing it is not burdened by state borders and that the white nationalists do not simply punch-down on African-Americans, but other racial groups and even some white ethnic groups (referencing Italians).
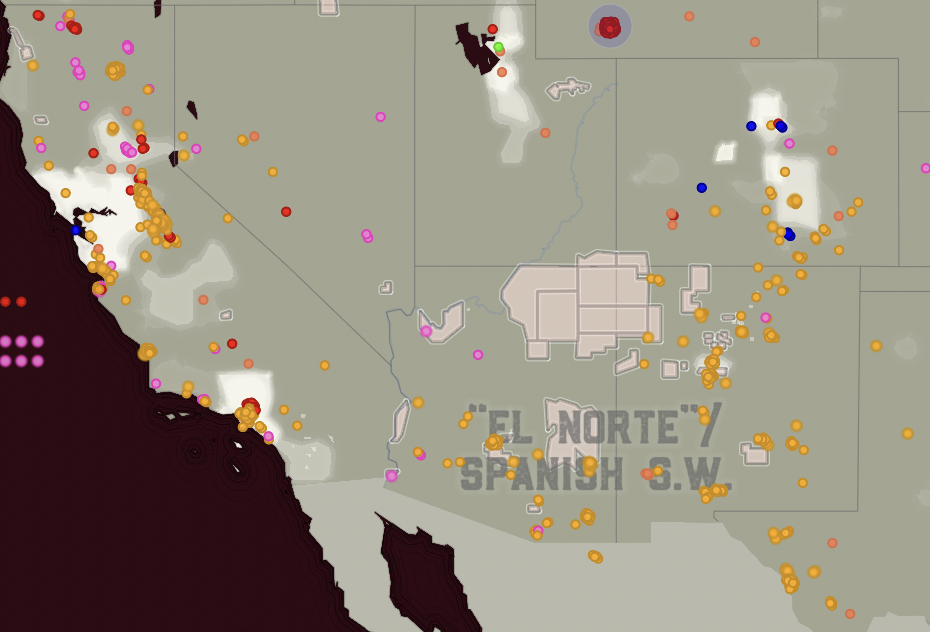
(White Supremacy Mob Violence).
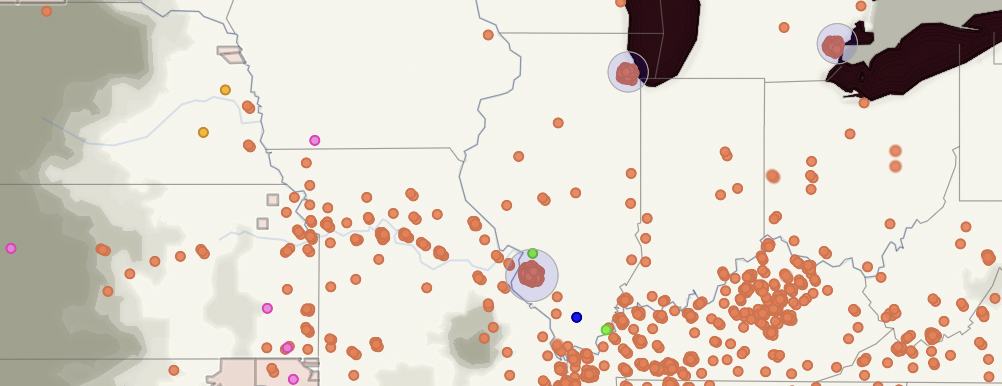
This map depicts a number of lynchings within Westward Expansion, California, and the Midwest.
I wanted to use my county from home as an example for why Work’s map does a better job than the EJI map.
Here is Lee County, GA on Work’s Map:
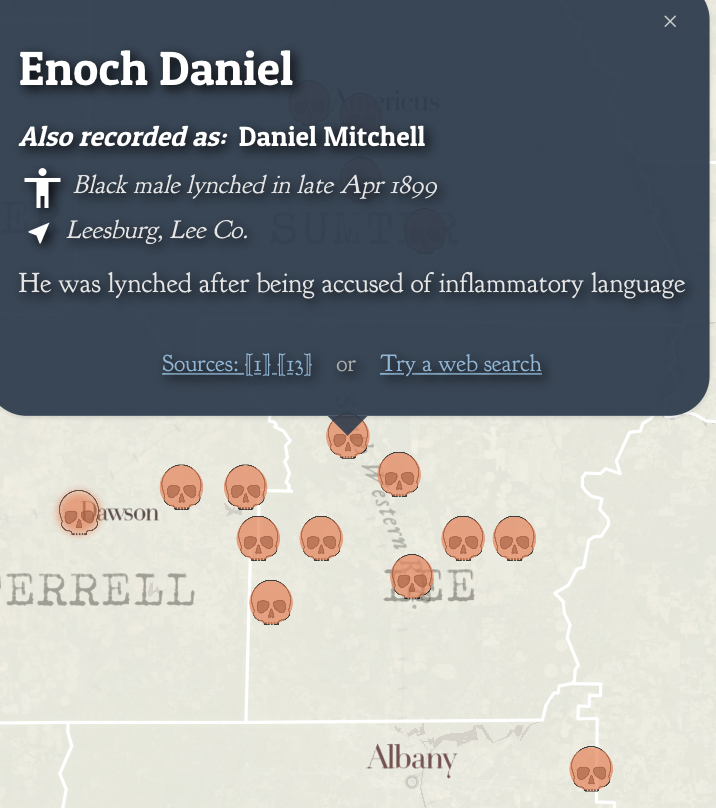
Here is Lee Ct. on the EJI map:
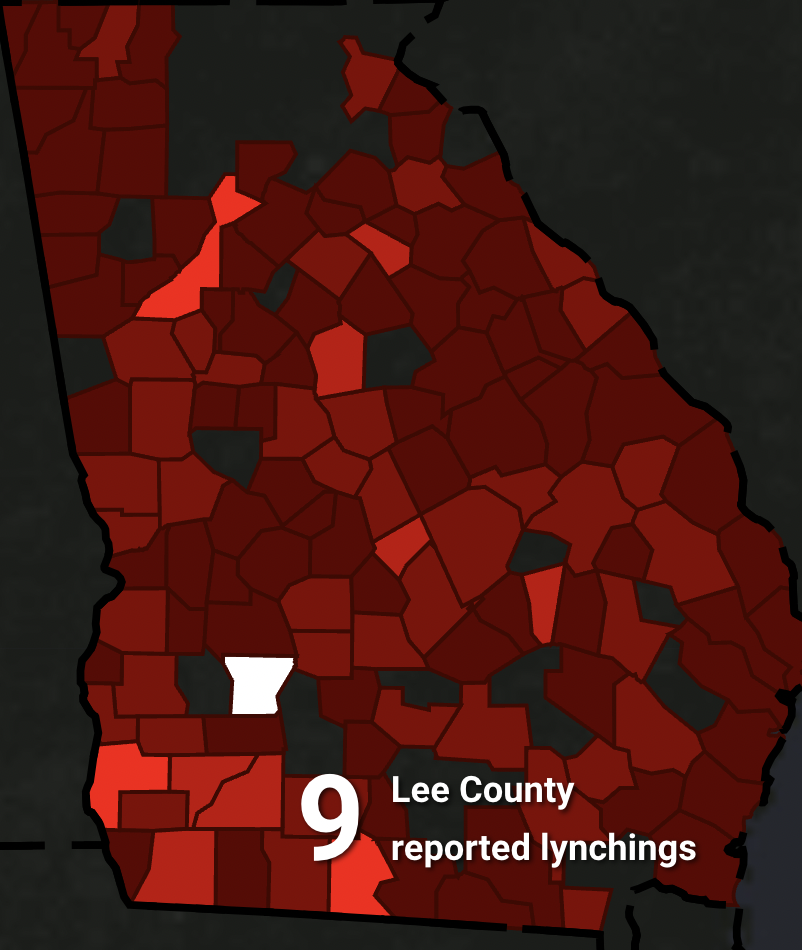
There is no mention of the names of those who were murdered, nor is there a reference to sources in the EJI map. Work’s map not only provides the reasoning behind the hate crimes, but also their sources to add supplementary materials to their storytelling.
I think within digital humanities, one has to be careful how their story is portrayed to an audience. As an English major as well as a history major, I have learned a lot in creative writing classes that whilst a story I write means one thing to me, once it is published it takes on different meanings depending on the audience. If I wasn’t a Southerner or if I didn’t read the article, I cannot help but wonder if I would understand the focus on the American South as a hotspot for racism in the EJI map. I think this is something to be mindful of when mapping minorities or the trauma of others. Data should come from multiple sources and nuance should be added if possible and applicable to the subject matter. I understand that the EJI map is political- it is meant to shock and it is meant to be minimal. They are demanding collective action as fast as possible, but (and not to go all Foucauldian again) ignore the non-linear construction of power under white supremacy. This is dangerous, white supremacy has seeped into the minds of not just white people, but minoritized groups as well, who foster hatred for other racial groups and/or even their own. This allows racism to fly under the radar. Lynching is just a stark example of what happens when this racism goes unchecked and festers before it becomes infected and is only cured through egregious acts of violence.
“Monroe Work Today’s Map of White Supremacy Mob Violence is an exemplar of ethical visualization, not because it is free of two centuries of baggage and biases, but because it acknowledges them, while also acknowledging the potential pitfalls of the very endeavor of transforming human beings into visualized historical data.”
“Racism in the Machine.”
Stories, especially those that are not are own, are hard to tell. It is important to acknowledge biases and provide the resources for audiences to reach out and interact with stories from members of the community that the mapmaker is trying to tell. People are not unerring, but there is something to be learned from accountability and the avoidance of knee-jerk reactions of “not me!” or “I don’t see color!” Only then can conversations begin to take place and the fostering of learning can begin. Readers should also, then, question the sources of information and the potential argument presented from visualizing history. It would be impossible for a historian to show every facet of history in their map, but one should question if those silences are intentional.
Emily Gaddy: ARCGIS Story Map
In case embed didn’t work : https://storymaps.arcgis.com/stories/7deeb5263ec84fbaae983e05d86c6ae6
Week 9 Practicum – Emily Gaddy

1880’s cultivation

1900’s Cultivation

1940s total cult
I think an obvious example of change overtime is the amount of land cultivated. More land started to become cultivated as the frontier started to close. There was a huge uptick in cultivation from the 1900s to the 1940s, but that could also have to do with the difference in timelines from 20 years from the 1880s to the 1900s, compared to 40 years from the 1900s to the 1940s. Oklahoma also blew up with crop production throughout the years. Kansas also did, hinting that they are a large producer of crops.
Stage 2 – Emily Gaddy: Construction of Omaha’s Redline
- My project aims to examine the installation of the North Freeway in North Omaha. In 1976, construction on the interstate began, finishing into the early 80s, with additions added into the late 90s. Because of this, I am choosing to look at the construction of the interstate as the years went on (from 1976-1998) and also the census records of the racial demographics of the area, from 1970-2000.
- I have contacted the Durham for photos of the highway during construction, the neighborhoods before construction, and the neighborhoods after the highway was built. I have also found oral interviews from the UNO archives from black Omahans, a few of which talk about their communities and the effect the highway had on them. I got in touch with the archivist for the Omaha Public Library for city records, and they gave me a few sources to look through as they consult their records for city planning. Here is a list of just a few sources I’ve amassed:
For census data I’ve been utilizing: https://www.nhgis.org/
The best source I’ve found so far is this very thorough corridor study of the North Freeway, detailing demographics, community response, and the map of the highway (I found this on Nebraska Department of Transportation’s digital archives): https://govdocs.nebraska.gov/epubs/R6000/B002.0014-1975.pdf
City Planning Book in Omaha Archives: https://omaha.bibliocommons.com/v2/record/S60C1056815
Part of UNO’s series on black, oral history in Omaha, Lerlean Johnson Interview (she filed a suit over the highway): https://revelation.unomaha.edu/ohms-viewer/viewer.php?cachefile=MSS-0130_Lerlean-N-Johnson.xml
OPS’ “Making Invisible Histories Visable Collection” in the UNO archives: https://archives.nebraska.edu/repositories/4/resources/3602#
Local Omaha historian, Adam Sasse, on the North Freeway: https://northomahahistory.com/2020/10/28/history-of-the-north-freeway-in-omaha/comment-page-1/
Douglas Ct. gis- street centerlines: https://data-dogis.opendata.arcgis.com/datasets/5ce15de3908744e183fc1fb8521e29a5_29/explore?location=41.302684%2C-95.949069%2C16.59
Palma Strand’s “Mirror, Mirror…”: https://www.openskypolicy.org/wp-content/uploads/2020/10/StrandRedlining.pdf
3. For how I would like to present this, I would love to do an interactive web map. I was very inspired by John Snow’s cholera map, especially with how it took into account human interaction and felt very personalized to the neighborhood in Soho. I am very drawn to the stories of these Omahans who have had their communities ripped apart and spliced in half. I would like to show the buildings that once stood and the census data. I also feel like if this wasn’t interactive and just a static map, it would be hard to read and difficult to decipher, like the map we did with redlining in Philly. I love to write, so I would love to tell a story, and I think this would be a good way to do it. I want it to do justice to the people who have lost their homes and tell their stories in a map that people can navigate to facilitate their own learning on overlooked Omaha communities.
4. There are not a lot of scholarly articles focused on redlining. I grew up in the South and there are numerous articles governing Jim Crow laws and physical segregation, but the death of Jim Cow did not signal equality, and Midwestern cities during the era were mostly ignored. Racism is systematic and the ghost of Jim Crow haunts cities throughout the United States- not just the South. Highways are a less obvious way white city councils could keep their cities segregated and their public records clean. I think this also shows how, even though anti-segregation laws are passed, there is still a lot of work to be done in regards to equal access to resources and racial reconciliation (or, honestly, just conciliation). Omaha history is extremely fascinating, but never really formally examined. I think in an era where public history is becoming more and more important, I think this needs to change.
Emily Gaddy – Mapping and Tracking Changing Ecology
Cunfer argues that the “plowing of the Great Plains for crop agriculture did not happen quickly,” which is true- the Great Plains had existed for centuries before European settlement, however, the introduction of European technologies and the colonization of the American West greatly contributed to a significant loss of farmland and ecosystems.

Geoffe Cunfer, “Pasture and Plows,” On the Great Plains, 2005. P. 18.
Before the introduction of the plow, American grasslands were far more abundant.

Cunfer. P. 31.
Humans and the environment obviously have a relationship to one another- both can shape and change one another. One aspect of this is Westward Expansion. As more people spread out West and plows were brought, wheat production went up, but grasslands started to disappear.


Henry Gannett, Wheat/sq. Mile, 12th census of the US, 1903.
This map is from 1903, here’s Cunfer’s map of grassland, for reference:

The commercialization of land was also something that was spread throughout the Western territories. When Native land was divvied up and disseminated to white settlers without consent, the sacred grasslands of the Plains Natives were destroyed for commercial agriculture and desecrated by those who saw land as a commodity. Some grasslands were destroyed intentionally by white settlers to speed along the centuries-long genocide and forced assimilation of Natives. Over-grazing led to more grasslands depleting, as well as the scramble to California during the Gold Rush. Settlers looking for gold or families looking for religious freedom would travel together with their wagon trains and leave destruction in their wake.
John Snow – Mapping Disease – Practicum


I think these types of maps would be super interesting in regards to demographics of disease-ridden neighborhoods. These could be used when showing if a certain population, either by race and/or socio-economic status, are more likely to be affected by certain hazards to public health. These could be used for my final project by showing the number of buildings demolished to make way for the North Highway and the proximity to black neighborhoods, perhaps.