
Growing up in what is colloquially called the “Dirty South,” there is an expectation of stupidity and racism associated with Southerners, especially those from the Dirty South. There is the misconception that we tote around shirts with “THE SOUTH WILL RISE AGAIN” in bold letters amidst the backdrop of the Confederate flag. Our accents are seen as hillbilly (especially in Appalachia) and there is no regard to the rich culture and there is no mention of black Southerners unless it is in regards to slavery or acts of racial violence. These stereotypes are not only rooted in racism, but also classism (often ignored in the United States). Only recently, with Georgia (my home state) becoming a swing state, are there more talks around political disenfranchisement in terms of voter suppression and the realization that a lot of Southern voices have been stifled by the (often) loud, far-right populations of those states. I credit Stacey Abrams for finally opening the floor up to conversations about modern-day voter suppression of black voices.
In digital mapping, there is a reliance on human-made algorithms and the whims of the mapmaker themself. The article we read used the example of the Twitter-made, AI, Taytweets, which used people’s Tweets to learn how to communicate less like AI and more like an actual person. Of course, humans are not infallible, and the computer coders that create AI are not neutral, so, as the articles states:

And that:

“Racism in the Machine: Visualization Ethics in Digital Humanities Projects”
It makes sense that misconceptions and stereotypes about differing geopolitical states would be prevalent in mapping and geographical history projects. The maps we used for this blog post show the same subjects, but in contrasting ways.
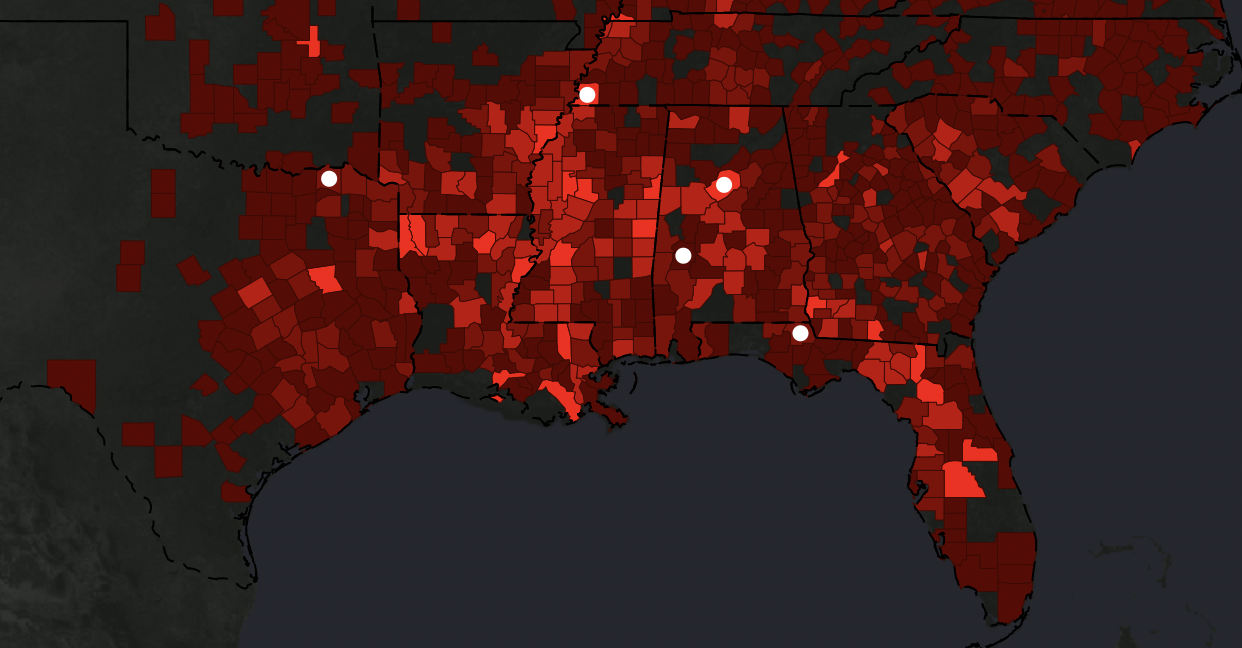
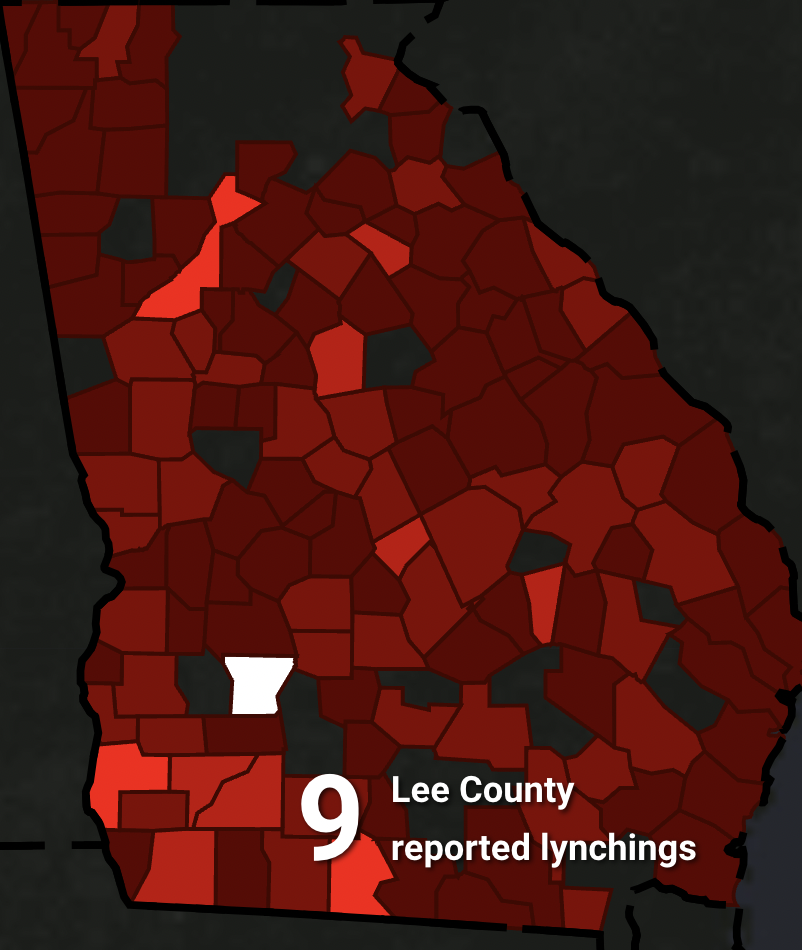
(Lynching in America, EJI and Google).
This map, made with a partnership with Google and EJI (the Equal Justice Initiative), focuses almost entirely on the state of racial violence in the Deep South. We’ve spoken in class about how maps tell stories and this one recirculates the stereotype of racial violence and racism being an act mostly committed in the South. While a majority of black lynchings did take place in the South, it is also important to note that that is because a higher concentration of Black people lived in the South than the North.
“Visualizing data that exclusively focuses on the African-American experience in the Southern United States provides an important argument about the nature of Jim Crow racism. However, purporting such data to be an inclusive representation constitutes a harm in the sense that it perpetuates common narratives of racial violence as a southern exception to an otherwise inclusive nation.“
“Racism in the Machine”
This shapes the systematic oppression and structure of white supremacy as being something linear- of power birthed from the top and trickled down to the bottom percent of people within white hegemony. White supremacy is not, pun intended, black and white. Racial violence, while extremely horrific is not the full story of white supremacists and their maltreatment and persecution of other racial and ethnic groups. Racial violence is usually the escalation of decades of whites being able to get-by with “smaller” crimes and abuses:
“The conflation of lynching with the full extent of racialized violence in United States history obscures the historic depth and breadth of the oppression of people of color. A black individual was far more likely to suffer public humiliation, assault, rape, and murder than a public lynching.“
“Racism in the Machine.”
I understand the reason why the mapmakers chose lynching, however, it is a physical and tangible manifestation of racial violence. The stories of black people being raped or abused are far too commonplace, so therefore there are few records documenting the crimes. However, white supremacy thrives not just on murderers and extremist groups like the Aryan Brotherhood, but on the complacency and the actions of everyday white people, who use “not me” statements and ignore the white supremacists tendencies that are conditioned into the white American populous through years of American historical propaganda and nationalism, regardless of geographic region or state. I lived in Southwest Missouri for a bit and I was surprised by how prevalent the Klan was there. I knew someone whose grandfather was a founding member of the Klan in Southwest Missouri. One day when I was cleaning out a closet in their home, I found their grandfather’s bloodstained Klans robes. It was terrifying- to see the ghostly manifestation of the United States racist terrorism in person.
The other map, made by Monroe Work, showcases more nuances in white supremacy, showing it is not burdened by state borders and that the white nationalists do not simply punch-down on African-Americans, but other racial groups and even some white ethnic groups (referencing Italians).
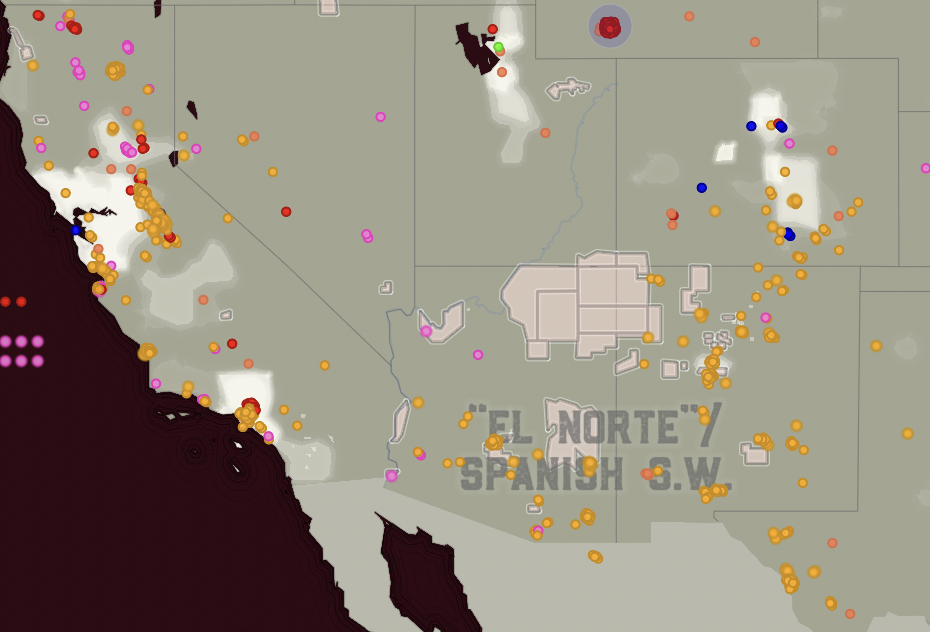
(White Supremacy Mob Violence).
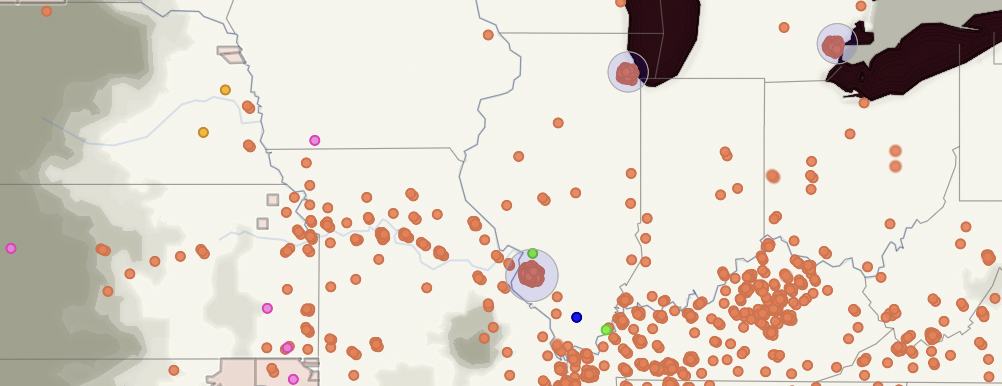
This map depicts a number of lynchings within Westward Expansion, California, and the Midwest.
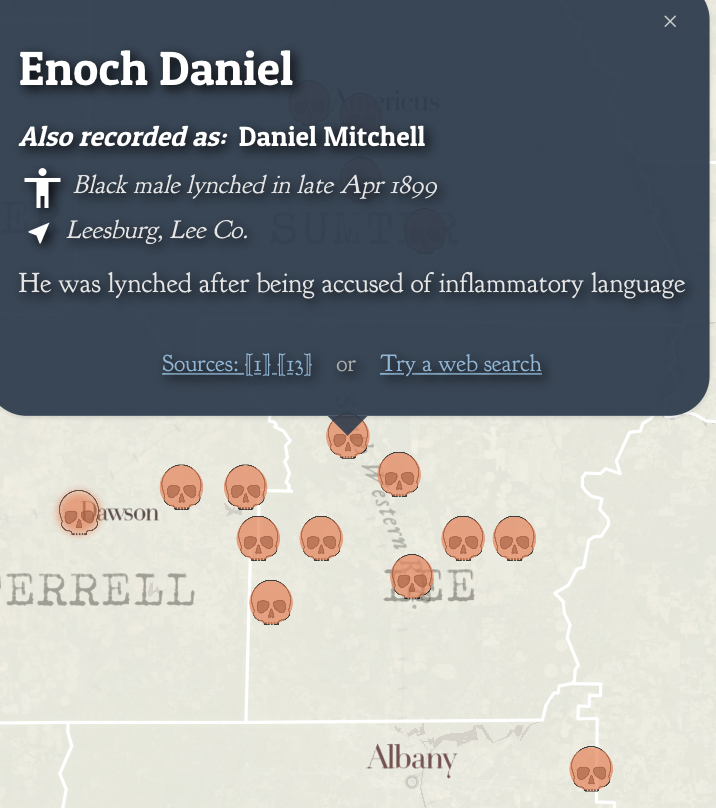
I wanted to use my county from home as an example for why Work’s map does a better job than the EJI map.
Here is Lee County, GA on Work’s Map:
Here is Lee Ct. on the EJI map:
There is no mention of the names of those who were murdered, nor is there a reference to sources in the EJI map. Work’s map not only provides the reasoning behind the hate crimes, but also their sources to add supplementary materials to their storytelling.
I think within digital humanities, one has to be careful how their story is portrayed to an audience. As an English major as well as a history major, I have learned a lot in creative writing classes that whilst a story I write means one thing to me, once it is published it takes on different meanings depending on the audience. If I wasn’t a Southerner or if I didn’t read the article, I cannot help but wonder if I would understand the focus on the American South as a hotspot for racism in the EJI map. I think this is something to be mindful of when mapping minorities or the trauma of others. Data should come from multiple sources and nuance should be added if possible and applicable to the subject matter. I understand that the EJI map is political- it is meant to shock and it is meant to be minimal. They are demanding collective action as fast as possible, but (and not to go all Foucauldian again) ignore the non-linear construction of power under white supremacy. This is dangerous, white supremacy has seeped into the minds of not just white people, but minoritized groups as well, who foster hatred for other racial groups and/or even their own. This allows racism to fly under the radar. Lynching is just a stark example of what happens when this racism goes unchecked and festers before it becomes infected and is only cured through egregious acts of violence.
“Monroe Work Today’s Map of White Supremacy Mob Violence is an exemplar of ethical visualization, not because it is free of two centuries of baggage and biases, but because it acknowledges them, while also acknowledging the potential pitfalls of the very endeavor of transforming human beings into visualized historical data.”
“Racism in the Machine.”
Stories, especially those that are not are own, are hard to tell. It is important to acknowledge biases and provide the resources for audiences to reach out and interact with stories from members of the community that the mapmaker is trying to tell. People are not unerring, but there is something to be learned from accountability and the avoidance of knee-jerk reactions of “not me!” or “I don’t see color!” Only then can conversations begin to take place and the fostering of learning can begin. Readers should also, then, question the sources of information and the potential argument presented from visualizing history. It would be impossible for a historian to show every facet of history in their map, but one should question if those silences are intentional.
A wonderful extended reflection on data visualization, the implication of mapping the trauma of others, and your own social position – skillfully weaved together. This is a thoughtful and moving essay and a fitting final blog for the class.