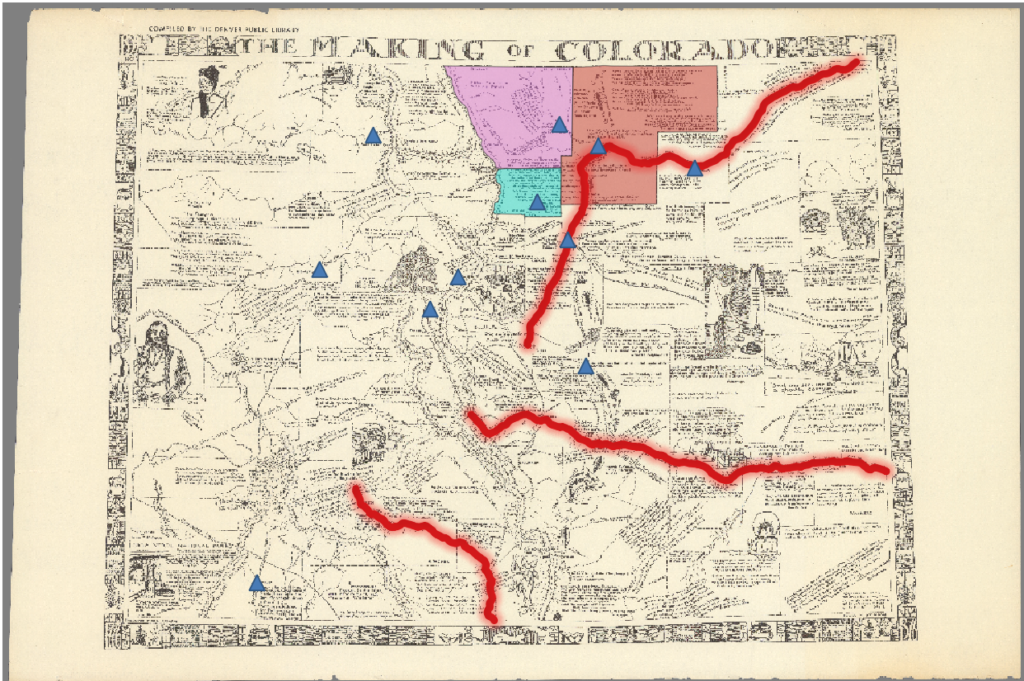
Across this map there a numerous drawings accompanied by captions that illustrate regional histories and notable features across Colorado. It is exceedingly difficult to assign vector categorizations to these components of the map that add depth. While I could add vectors like polygons or points to indicate where these images and their captions appear on this map, vector categorizations would fail to capture the abstract ideas, emotions, and opinions these images and descriptions communicate to the reader. Even quite transparent vectors could obstruct readers’ views of these features by altering their coloration and character.
One attribute I believe would have been appropriate to add to the line vectors I overlaid on three of Colorado’s largest rivers would be the watersheds that these rivers fall into and where they flow after leaving Colorado. Adding data like this to the line vectors on the rivers in this map could give readers a better understanding of how Colorado, and, more specifically, the Rocky Mountains, shape the rivers that flow throughout the United States. One attribute I believe would have been appropriate to add to the polygon vectors I overlaid on Larimer, Weld, and Boulder Counties is when each county was founded and if its borders on this map are the same as their borders today. This attribute data would give readers of this map, which is already focused on telling the history of Colorado as of 1935, an even better understanding of the history of Colorado’s counties and how/if they have changed since this map was produced.
One spatial relationship I noticed while digitizing elements of my map is how most towns and cities in Colorado have a large river running through them or immediately adjacent to them. While I have visited towns and cities across the state and personally witnessed the rivers that flow through them, I never really realized truly how many urban centers in the state centered on rivers. I primarily noticed this when I was overlaying line vectors over the Rio Grande, South Platte, and Arkansas Rivers. As I moved along these rivers overlaying vector data onto them, I began to realize how many towns and cities existed around and adjacent to these rivers. I have been familiar with the paths of these rivers for year, but I never truly realized just how central they were for the formation and development of towns and cities across the state. As a result of noticing this spatial relationship, I was able to see my historical map in a new way. I now understood why, despite the minimal topography this map depicts, rivers are clearly demarcated in every corner of the map, including even relatively small tributaries near the headwaters of rivers. As a map intended to tell the history of Colorado, I now see why the mapmaker included detailed depictions of the state’s rivers as they were critical components of the formation and development of most of the towns and cities littering the state.


Nicely done and wonderful reflection- ‘vector categorizations would fail to capture the abstract ideas, emotions, and opinions these images and descriptions communicate to the reader.’ – nicely put. Depth is difficult to map in general, and perhaps hard with vectors exclusively.