
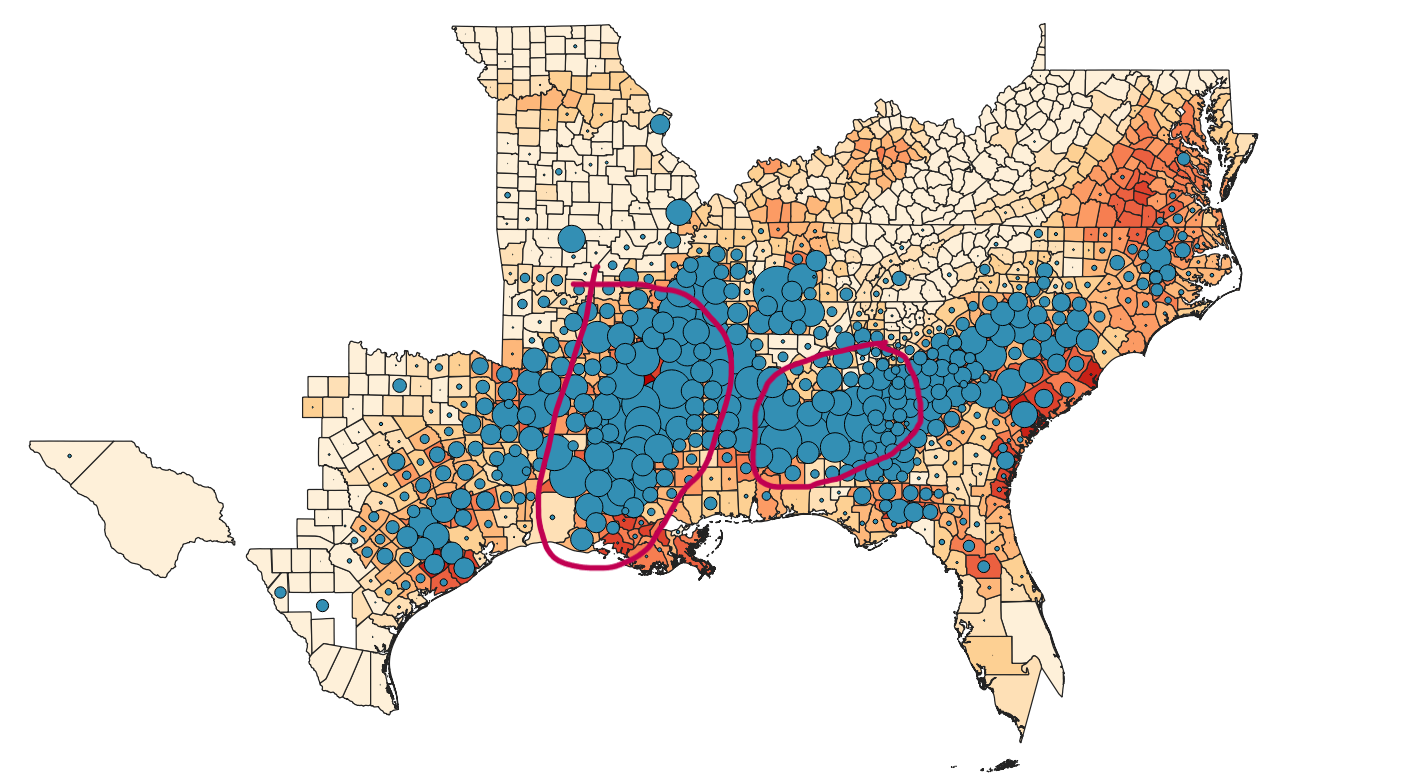
Counties in the Confederacy that had high corn production rates seem to be patterned without respect for the distribution of enslaved individuals.
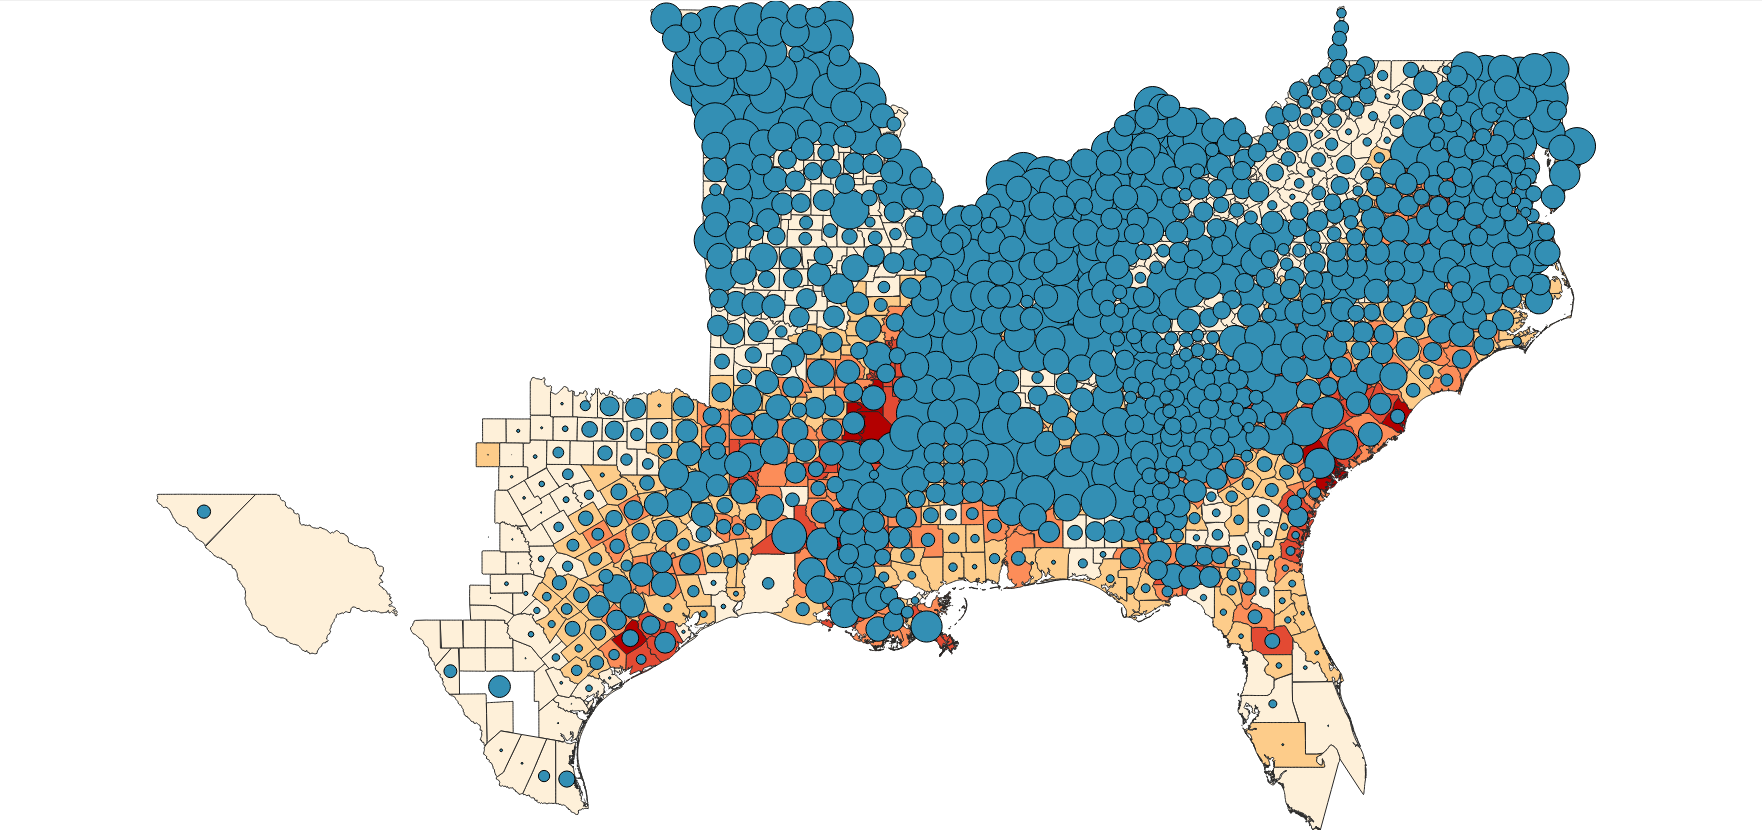
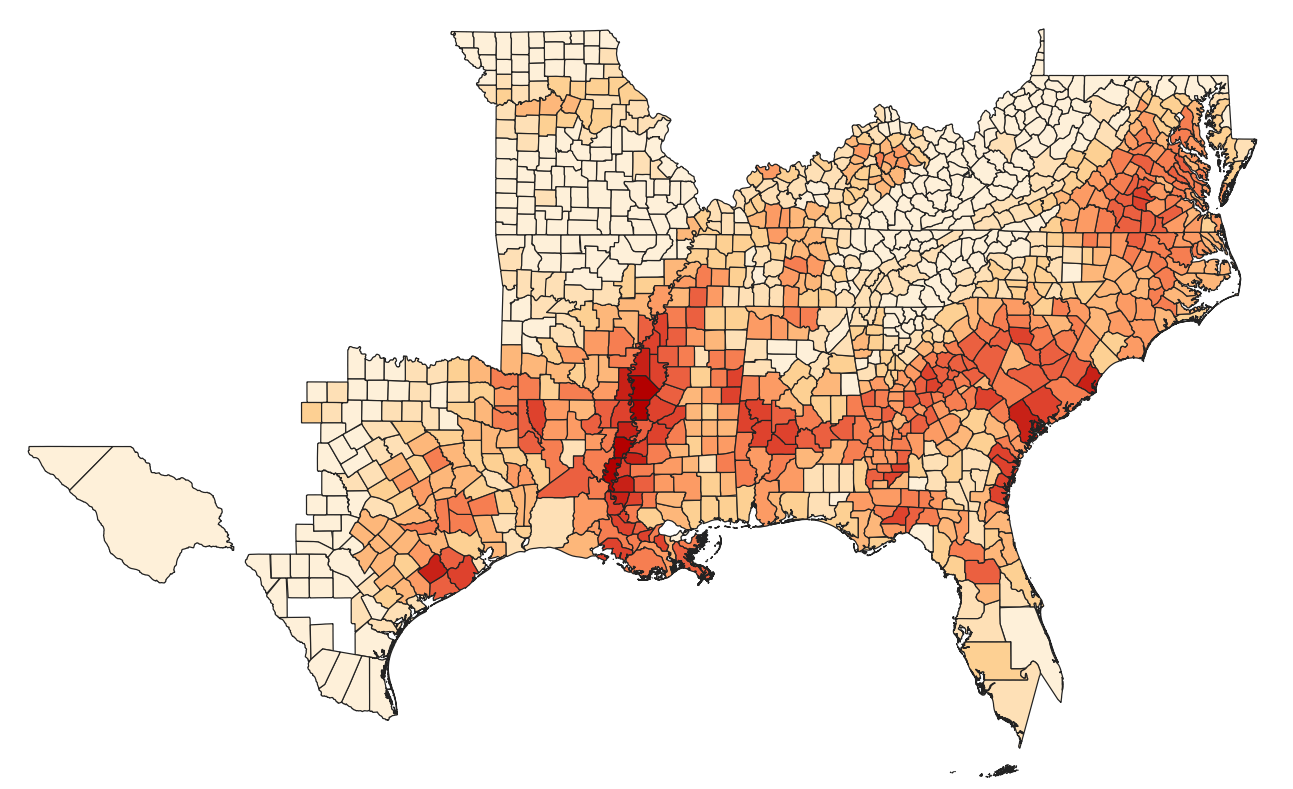
While it is admittedly somewhat challenging to read the above map, if we compare it to this map below that depicts percentages of county populations that were enslaved:
We can see that corn production is not patterned after counties mostly populated by enslaved individuals. High-percentage slave and high-percentage free counties across the Confederacy produced large amounts of corn.
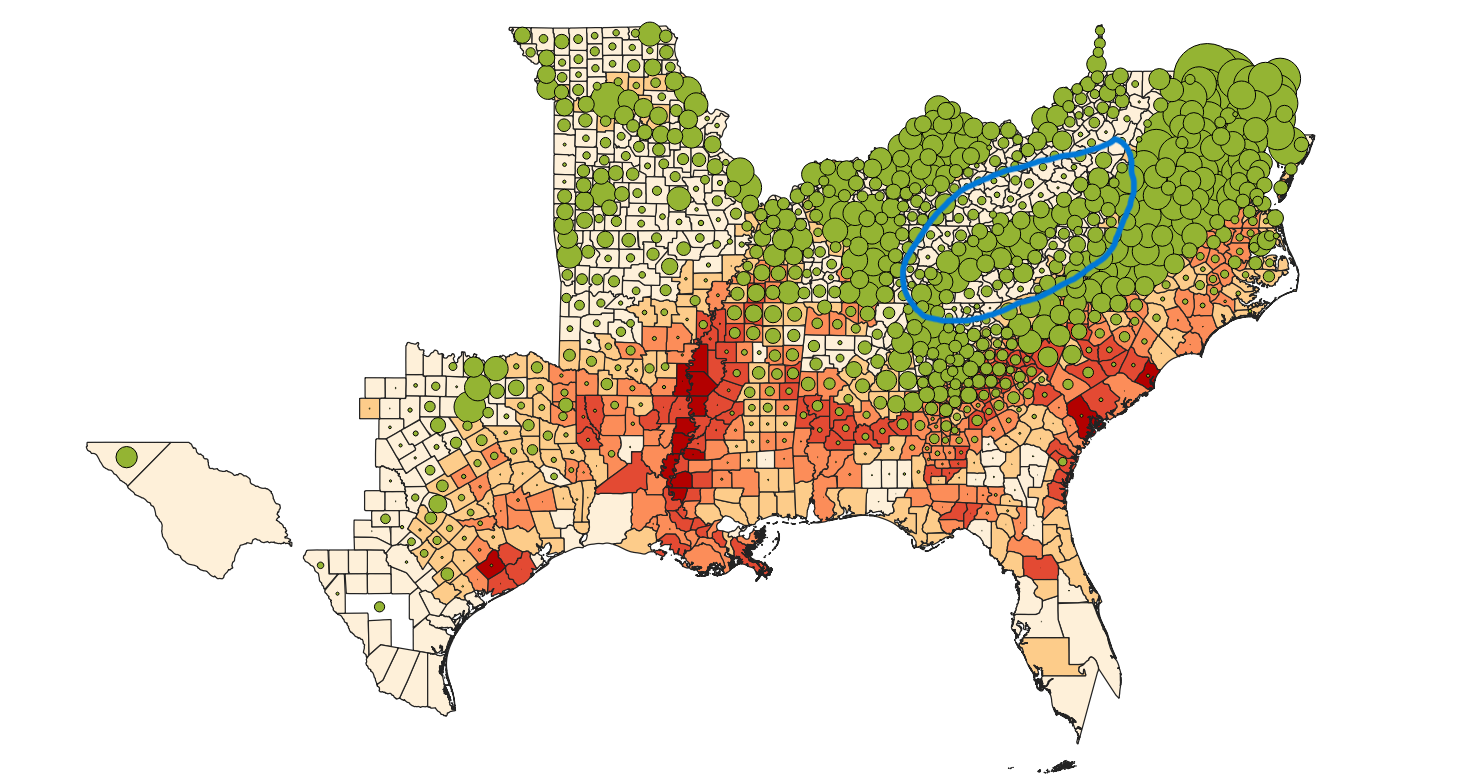
Counties in the Confederacy that produced large amounts of wheat were not counties with a high percentage of enslaved inhabitants. Instead, as demonstrated on the map below, the highest wheat producing counties did not have high percentages of enslaved inhabitants. Many such counties had almost no enslaved inhabitants, such as the high wheat producing counties in the Appalachian Mountains.
Most of the highest corn producing counties were in areas with significantly fewer enslaved inhabitants compared to the Deep South where slaves generally made up a higher percentage of county populations.
Counties in the Confederacy that produced large amounts of tobacco were primarily located in western Kentucky, northwestern Tennessee, and eastern Virginia which all encompassed counties with relatively low percentages of the population living in slavery.
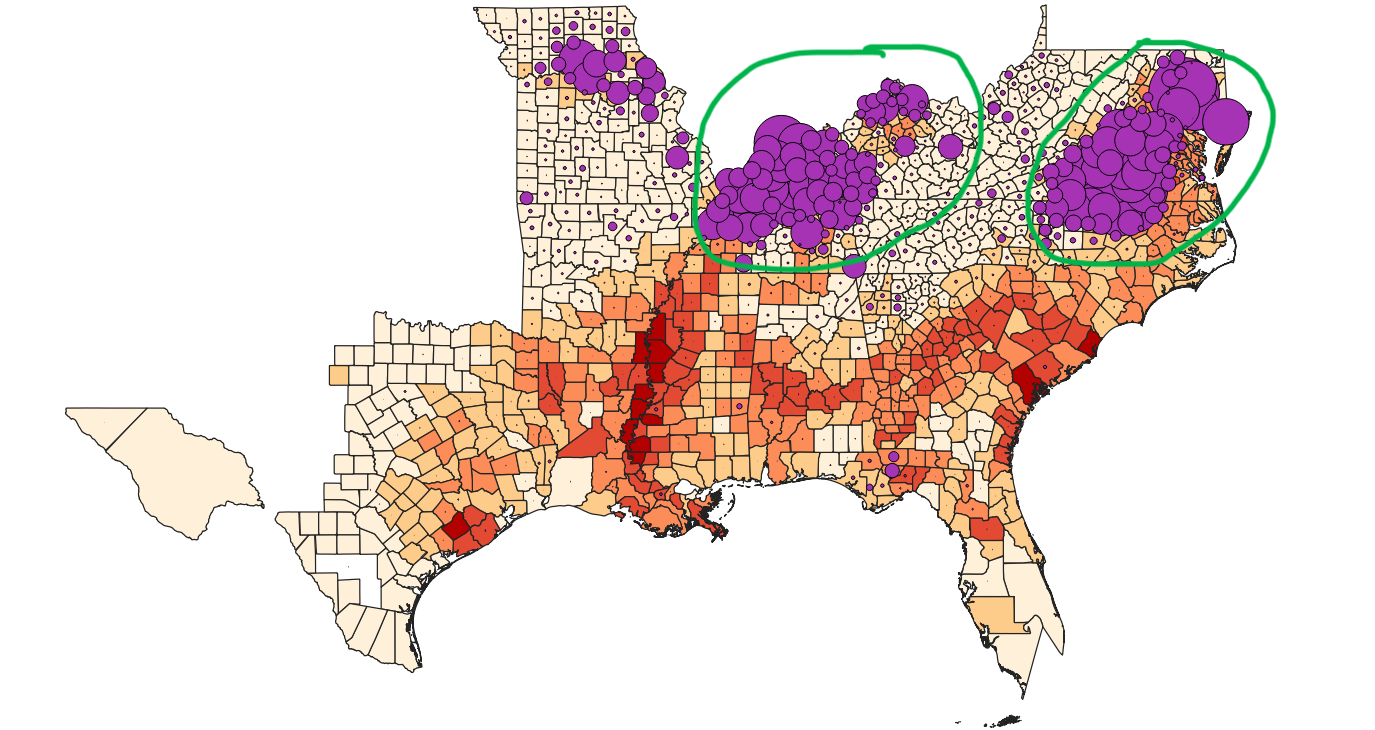
The comparatively low percentages of enslaved people in counties with high tobacco production rates indicates that enslaved labor was not a critical part of tobacco cultivation and processing.
Almost all counties in the Confederacy with a high rate of cotton production also had some of the highest percentages of enslaved people in their populations. Counties along the Mississippi River and in central Alabama with particularly high percentages of their population consisting of enslaved people appear to have served as powerhouses of cotton production.
The immense production rates of cotton in counties with most of their population in slavery suggest slaves were used to cultivate and process cotton extensively in the Confederacy.
Counties with high production rates of sugar were primarily located in and around the Mississippi River Delta, an area with counties composed of high percentages of slaves.
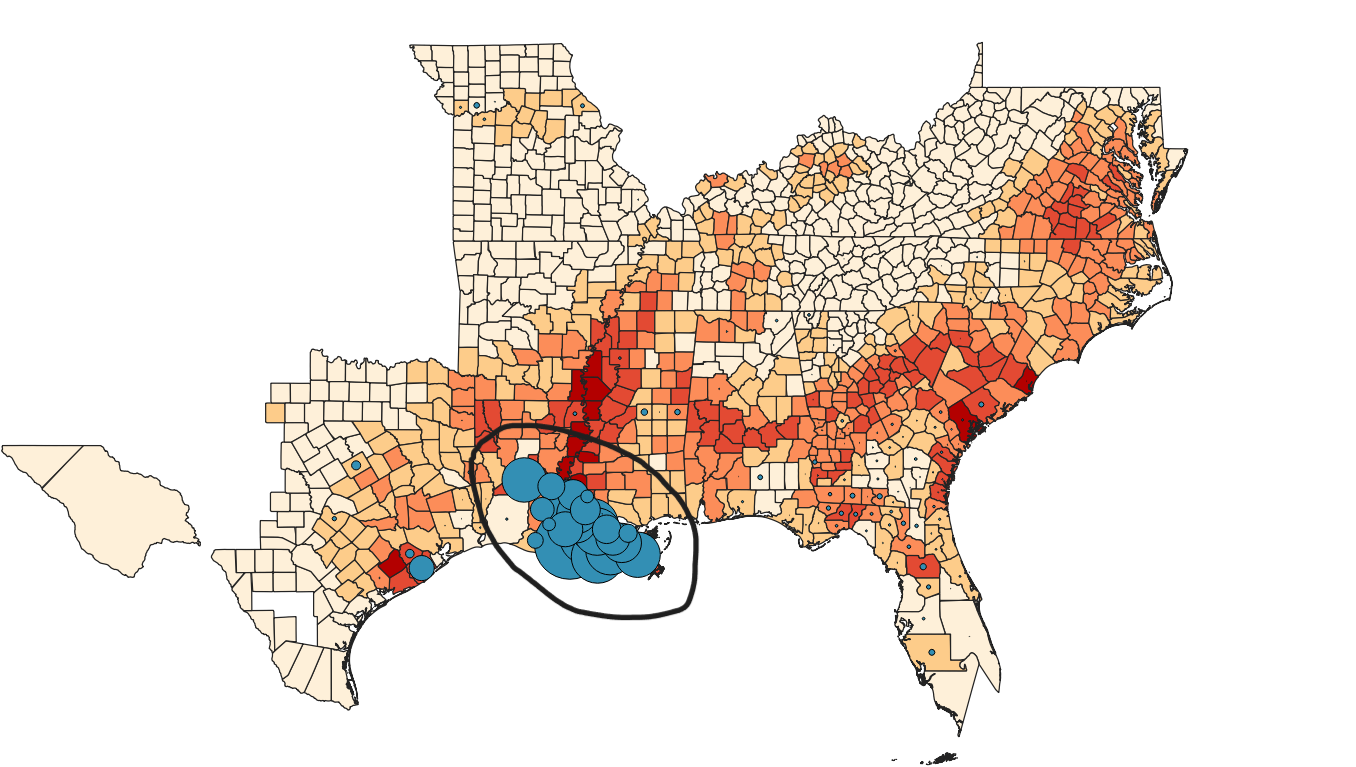
The relatively high percentage of enslaved inhabitants of the counties in and around the Mississippi River Delta, coupled with their extremely high sugar production rates, indicates that enslaved labor was likely a critical component of the cultivation and production of sugar.
All these maps of crop production rates and enslaved population percentages in the Confederacy tell us that cotton production using enslaved labor was the economic cornerstone of the Confederacy. The extensive cultivation of cotton across the Deep South, as well as the high percentages of enslaved inhabitants in the counties with the highest cotton production rates, indicates that the Confederacy put significant resources into ensuring the continued intensive cultivation of its “cash cow,” cotton.
Though not nearly as important to the Confederate economy as cotton due to the limited geographic regions in which it was cultivated, sugar was also likely an important cash crop for the Confederacy. Again, the extremely high production rates spatially coinciding with counties mostly populated with enslaved individuals indicate a significant commitment on the part of the Confederacy to continue to invest in commercial production of sugar with enslaved labor.
Excellent!