
I am unable to embed the story map for some reason. Here is the link to it.
Stage No. 5 – Final Map Project
Campus Updates : 1950 — 1980, How much do you know about the history of your college?
I hope you have a good summer,
Leah R.K.
Stage 5
Stage 5 – Andrew Merfeld
Stage 4
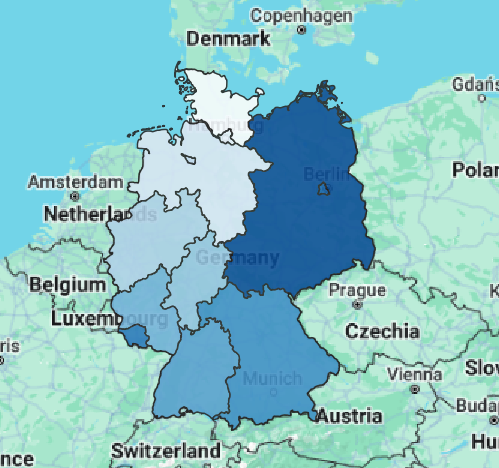
At this point in my project, i have added together data from 1970 to 1987. I have not added in the census from after 1970, but once I have, there will be comparisons between before and after the fall of the Berlin Wall, reflected by the population changes between German states.
Stage 3
Here are scholarly sources for my project
- Over-All Report (European War). United States Strategic Bombing Survey, 1945.
- Kido, E. “Population Movements in Germany after the Collapse of the Third Reich.” Jstage, https://www.jstage.jst.go.jp/article/kokusaiseiji1957/1988/89/1988_89_57/_article/-char/en.
- Guianne, Timothy. “Population and the Economy in Germany, 1800-1990.” Yale University, 1998.
- Mauri, A. (2019, April). East German Perspectives: The Berlin Wall and its Evolution as Cultural Heritage. Princeton University. https://tortoise.princeton.edu/2019/05/09/east-german-perspectives-the-berlin-wall-and-its-evolution-as-cultural-heritage/
- Decressin , J. (1994, June 1). Internal migration in West Germany and implications for East-West salary convergence. Springer Link. https://pubmed.ncbi.nlm.nih.gov/12319451/
- Adebahr, H. (1969). Internal Migration and Regional Wage Levels. An Analysis of Internal Migrations in the Federal Republic of Germany 1957-1967. Journal of Contextual Economics, 89(5), 557–578.
- Klüsener, S. (2014). The East-West Gradient in Spatial Population Development Within Germany. Historical Methods: A Journal of Quantitative and Interdisciplinary History, 47(4), 167–179.\
- Gnest, H. (2008). The development of supralocal spatial planning in the Federal Republic of Germany from 1975 to the present day. SSOAR. https://www.ssoar.info/ssoar/
- Goldstein, J. (2014, September). A geographic analysis of fertility decline in Prussia. JSTOR. https://www.demogr.mpg.de/papers/working/wp-2010-012.pdf
- Global Census Archive. East View. (2024, April 10). https://www.eastview.com/resources/gca-pubs/
Here are sources for data/secondary resources
- Cologne, Germany metro area population 1950-2024. MacroTrends. (n.d.). https://www.macrotrends.net/global-metrics/cities/204358/cologne/population
- O’Neill, A. (2024, February 2). Population of east and West Germany 1950-2016. Statista. https://www.statista.com/statistics/1054199/population-of-east-and-west-germany/
- Global Census Archive. East View. (2024a, April 10). https://www.eastview.com/resources/gca-pubs/
- Population by nationality and sex. Federal Statistical Office. (2023a, June 20). https://www.destatis.de/EN/Themes/Society-Environment/Population/Current-Population/Tables/lrbev02a.html
- BBC. (2019, November 5). Fall of berlin wall: How 1989 reshaped the modern world. BBC News. https://www.bbc.com/news/world-europe-50013048
- Breuer, R. (n.d.). Germany before and after reunification – DW – 10/03/2020. dw.com. https://www.dw.com/en/germany-before-and-after-reunification/g-55082387
- The fall of the wall and German reunification. deutschland.de. (2018, September 27). https://www.deutschland.de/en/topic/politics/germany-europe/the-fall-of-the-wall-and-german-reunification
- Council on Foreign Relations. (n.d.). After the Berlin Wall: Europe’s struggle to overcome its divisions. Council on Foreign Relations. https://www.cfr.org/article/after-berlin-wall-europes-struggle-overcome-its-divisions
- Gramlich, J. (2019, October 18). How the attitudes of West and East Germans compare, 30 years after fall of Berlin Wall. Pew Research Center. https://www.pewresearch.org/short-reads/2019/10/18/how-the-attitudes-of-west-and-east-germans-compare-30-years-after-fall-of-berlin-wall/
- Chapple, A. (2020, July 18). Berlin: After the war, before the wall. RadioFreeEurope/RadioLiberty. https://www.rferl.org/a/berlin-a-city-of-rubble-after-the-war-and-before-the-wall/30733579.html
Stage 5 Five Points Neighborhood. Levi Laib
Sam Ellerbeck – Stage 6
CRP and White-tailed Deer in Iowa
The Conservation Reserve Program is a federally funded operation that provides a degree of protection and support for ecosystems in the United States. For deer hunters, the CRP is beneficial in that it maintains land suitably for deer and promotes environmental diversity in plant and animal species. Currently, the state of Iowa is known for having excellent hunting, particularly for white-tailed deer. However, it was not always like this in the past. By 1900, hunting white-tails was banned due to extremely low population numbers. Eventually, the white-tail population recovered, and in the 1950s, Iowa lifted the hunting ban. With the CRP’s creation in 1985, land was converted into many protected regions appropriate for white-tails, allowing the species to grow in number immensely. Recently, CRP acreage in Iowa has decreased, which is causing white-tail harvests to decrease as well. The maps show white-tail harvests per CRP acreage in Iowa’s counties over time, and it seems clear that there is correlation between deer harvest numbers and the amount of CRP-protected land. As CRP acreage continues to decline, the concern is that white-tail deer populations may drop dramatically, potentially even to what it had been in 1900, where it was thought that there were less than 100 of them in the state.
One strength of this mapping product is that it narrates this cyclical pattern of white-tail population numbers over time very well. The history provided was very interesting and relevant to the conclusions drawn. A good connection was made between the past (very low white-tail population) and what the future might look like if CRP acreage continues to decline. Additionally, I thought that the use of a video to show change in harvests per CRP acreage over time was good. The maps and graph also complemented each other very well, and they were both able to emphasize the correlation between deer harvests and the CRP. Lastly, the presentation was visually consistent. Everything was matched to the same color scheme, which made the project look very professional.
One critique that I may offer concerns other potential reasons why white-tail hunting harvests have decreased, other than a connection to CRP protections on land. I was curious if a decrease in harvest numbers means that the overall population has decreased as well, or maybe other things – like less hunting activity in the last 20 years, just as an example – could also explain a decrease in harvests. It would be interesting to see if harvest numbers are also correlated to population numbers.