Madeline King, Blog Post 10 – Maxims vs Consequences

The reading, “Racism in the Machine: Visualization Ethics in Digital Humanities Projects,” by Katherine Hepworth and Christopher Church began its discussion by introducing the problem of neutrality in digital projects. While many things have the perception of neutrality, their structures, choices, and backgrounds come from long-imposed structures of oppression, like racism. Attempting to create a neutral project (especially one generated by AI), will inevitably result in the same problematic structures current society is created on becoming visible and a prominent aspect of those projects. Digital Projects need an argument, or at least some critical intention.
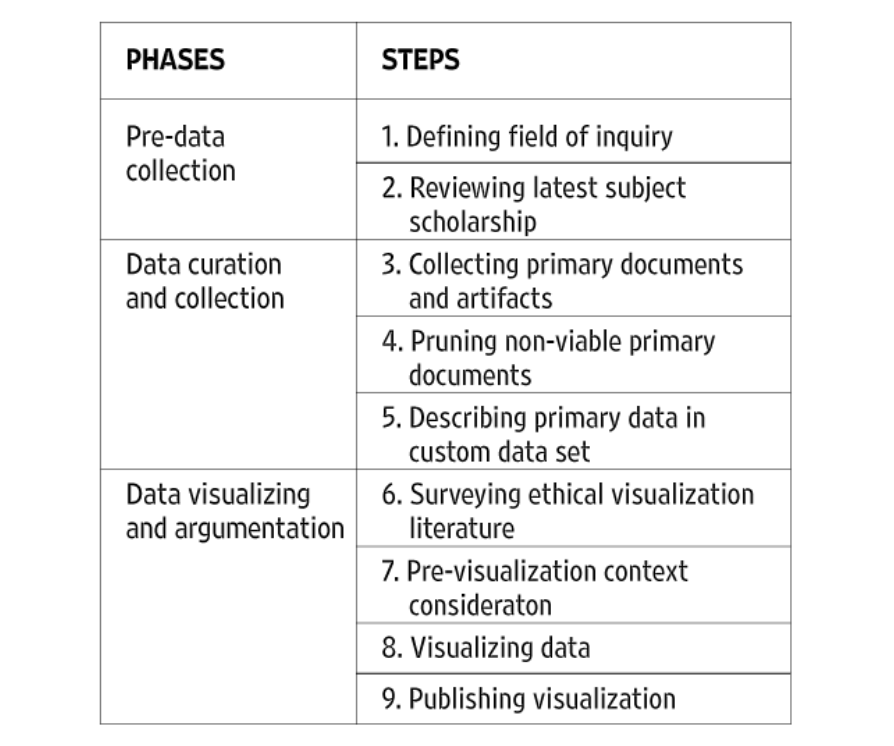
A chart of Hepworth and Church’s outline

Within the argument or critical intention of a digital project, it is important to approach it with a plan of action. Hepworth and Church’s paper proposes a multi-step plan, to best ethically create a digital project. This plan had three phases (pre-data collection, data curation and collection, and data visualizing and argumentation). Between the three phases outlined, Hepworth and Church propose nine steps (defining the field of inquiry, reviewing the latest subject scholarship, collecting primary documents and artifacts, pruning non-viable primary documents, describing primary data in a custom data set, surveying ethical visualization literature, pre-visualizing context consideration, visualizing data, and publishing data).

Of the steps and phases that Hepworth and Church lay, I believe that surveying and pre-visualizing is one of the most important ethical considerations. The inclusion of a test audience or test projects draws a distinction between maxim-based, or deontological ethics, and consequential ethics. While I believe that deontological ethics has some merit, I also believe that the consequential aspect of digital projects is the more important consideration. The saying “the road to hell is paved with good intentions” is important here. One’s purpose for creating a project could be neutral or positive, but its actual consequence is negative. Take the AI Twitter Chatbot for example. The maxim behind the creation of this bot was to create a fun experiment (an ethically neutral to the positive distinction), however, the consequence was a racist chatbot (an ethically negative distinction). Bluntly, in consideration of publishing a widespread digital project, intention does not matter (at least not to the same extent as consequence).

The examination of maxims and consequences can be evaluated in the two digital humanities projects that were outlined in the reading, “Lynching in America: Racial Terror Lynchings” and “White Supremacy Mob Violence.”
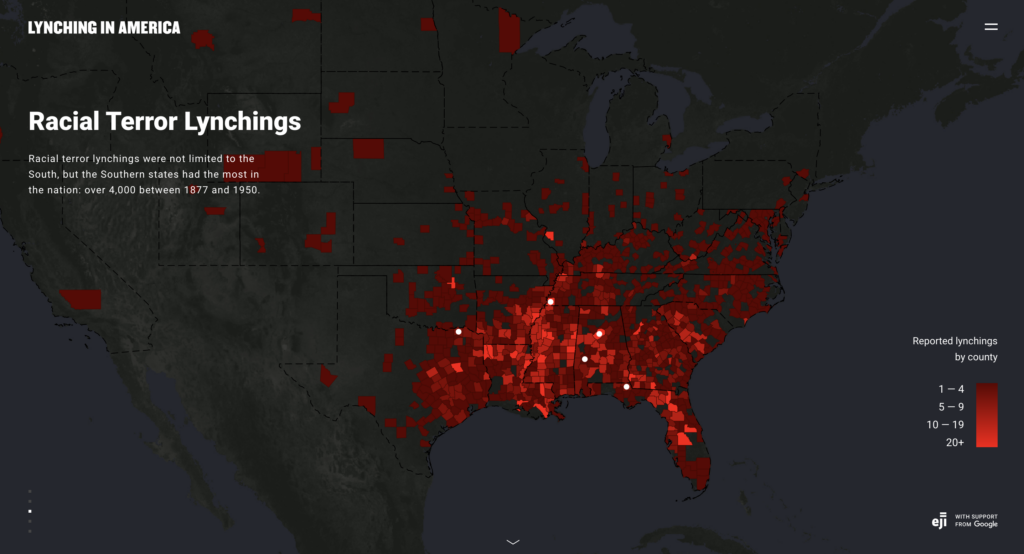
A screen grab of the current “Racial Terror Lynchings” Project

The intention of “Lynching in America; Racial Terror Lynchings” was to be part of a larger group’s work on prison reform. However, the consequences of this project do not ethically reflect the noble maxim of the project. The first problem, as outlined by Hepworth and Church, is that it initially made little consideration for lynchings that occurred outside of the Deep South. When it did consider these lynchings, it still only considered African American lynchings. The consequence of this project is that it becomes less of an argument and more of an assertion. The assertion is that African Americans were the sole victims of lynching and that this act of terror was a predominantly geographic problem.

Without clearly presenting the evidence, or presenting any other information on lynchings that occurred against non-African American individuals, the project does not allow the viewer to think for themself, and draw a conclusion outside of the assertion made. Instead, the project asserts its own (incorrect) conclusions to the reader, a conclusion that is backed by its purpose as a tool for prison reform. The issue with the argument of this project is not that it is a weak one, terror lynchings on a racial basis are a well-backed historical event (especially those committed against African Americans). The issue is also not that the cause of the project is bad. The issue is that there is no argument at all, instead the project is an assertion that gives in inaccurate understanding of lynchings.
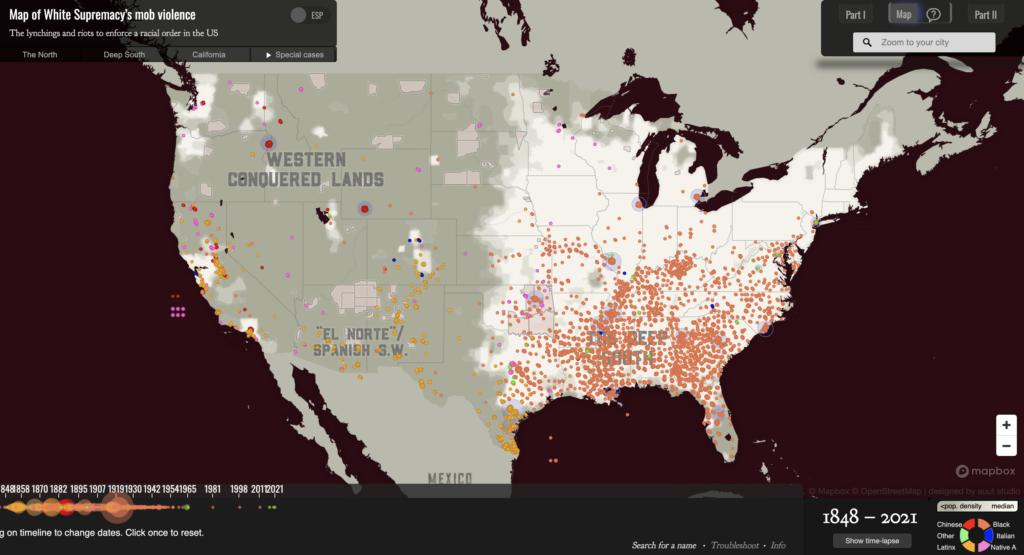
A screen grab of the “White Supremacy’s Mob Violence” map
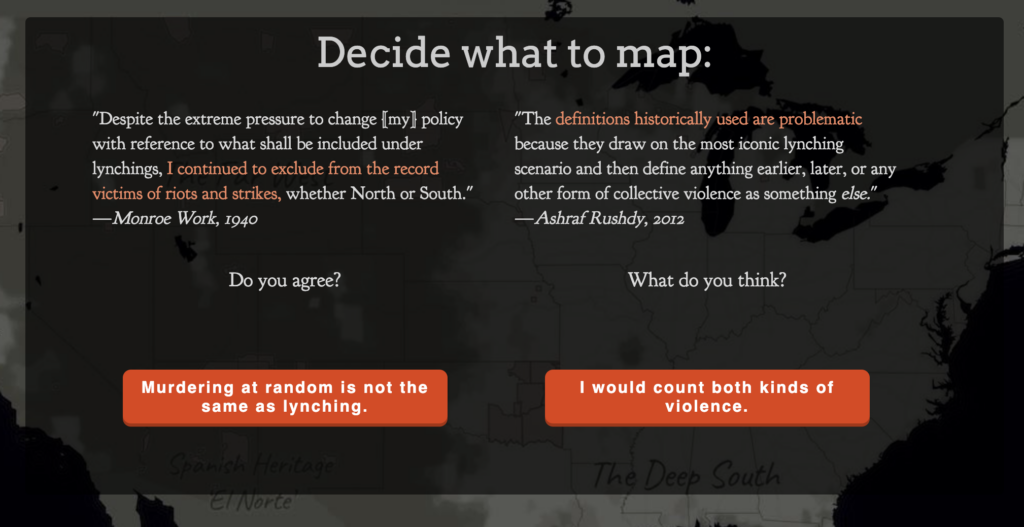
A picture of some of the interactive features of the “White Supremacy Mob Violence Project”

Provided as an alternative to the “Lynching in America” project, the “White Supremacy Mob Violence Project” provides a more ethical example of its consequence. The first striking difference between the two is how much more interactive this project is. Throughout the project, the reader is provided with choices. They can choose whether they consider something murder or not. They can choose whether or not they want to see the sources of information. The reader is provided definitions and examples to inform these choices. Within the actual map, each instance of lynching is given information. A person’s name, or at least identifying features is given (as well as the known reason for the lynching). The race of the person lynched is also given (a stark contrast from the information presented in the first project). The consequences of this project are an argument, not an assertion. With the information given to the viewer of the project, the project argues for the reader to evaluate. Looking at the races of people lynched, the reasons for the lynchings, and the dispersal of the lynching, the reader is left with the argument that these were racially influenced hate crimes.

Both projects have noble maxims. The first project intends to call to mind the problems with the modern prison system, especially the problems faced by African American men. The second project intends to highlight America’s historic problem with white supremacy’s mob violence. However, it is the consequences that distinguish to two ethically. The consequence of the first project draws an asserted conclusion that leaves out information and can be seen as misleading to an audience on the historical violence that occurred. The consequence of the second project is an informed viewer who can consider a strong argument on the racial motivations behind lynchings.

Bibliography

EJI and Google. “Lynching in America: Racial Terror Lynchings.” https://lynchinginamerica.eji.org/explore

Hepworth, Katherine and Christopher Church. “Racism in the Machine: Visualization Ethics in Digital Humanities Projects.” Digital Humanities Quarterly. Vo. 12, no. 4 (2018).

Monroe and Florence Work. “White Supremacy Mob Violence.” https://new.express.adobe.com/webpage/nKAyaWTMZtLxS/

Gabe Murphy: Blog 8

With any argument, publication, presentation, or comment (online or in person), ethics should be considered. In terms of mapping, one should value honesty, fairness, and an unbiased representation of the proposition they are trying to make. With any set of data, numbers and visuals may be skewed/edited in order to promote a certain agenda–which is something all readers should be aware of. Look into map cartographics and classifications. Look into the data sources. Look into the map-makers history. All of these things can guide you towards the reliability of the map, and if its methods are ethical. History itself is much more than just numbers, but unreliable storytellers and map-makers can use data to enhance a story that is far from the truth. Remember the example of the vehicular crashes map of Southern California that was presented in class; it appeared as if certain areas had unsafe roads, bad drivers, or a mix of both? However, it was more of a representation of population numbers than anything else. More people means more drivers, which means more crashes. The author used this to their advantage to show an “increased danger associated with driving.” Yet that was far from reality. Those with bad intentions can do similar things with all sorts of topics and maps–so be aware of what is presented, how it is presented, and who is presenting it. When creating maps of your own, remember these values and uphold standards that you want others to adhere to.

Now, let’s take a dive into this week’s assigned readings. The two maps given are much more than sheer numbers: they are deep maps with associated readings and stories. In Monroe’s map, each lynching is tied to a name, gender, when they were lynched, where they were lynched, and why they were lynched.

Monroe & Florence Work Today. 2016. “Map of White Supremacy Mob Violence.” PlainTalkHistory. https://plaintalkhistory.com/monroeandflorencework/?u=2

It uses point vectors to associate deaths and certain coordinates (I presume), a very effective and efficient way to differentiate this map from a typical choropleth map. The tie to personal stories creates a much darker effect for the reader–instead of promoting people just as numbers. 

Monroe & Florence Work Today. 2016. “Map of White Supremacy Mob Violence.” PlainTalkHistory. https://plaintalkhistory.com/monroeandflorencework/?u=2

Further, a timeline along the bottom expertly shows change over time (a common struggle for cartographers). I would like to use/create something like this for my final project. 

Instead of using maps TO tell a story like Monroe, EJI tells a story and uses maps to AID in this. It first delivers personal anecdotes, quotes, memories, and a short film to show how slavery progressed into a looming issue of lynching, and now into mass incarceration. Monroe focused on the issue of lynching, while the EJI went back to the root issue (slavery) and showed how this progressed as laws/society changed. An important quote guiding me towards this realization was from Anthony Ray Hinton, an inmate who was wrongly put on death row. 

Equal Justice Initiative. “Lynching in America.” EJI. https://lynchinginamerica.eji.org/explore

Clicking on this then takes you to a short film about his circumstances, and further down the page two maps are presented. One shows the migration of African Americans out of the south using a decade-by-decade choropleth maps of state AA % population, and another is a choropleth map county-wide for lynching data. 

For both of the projects above, original reports and sources are listed so that readers are able to read and come to their own conclusions if need be. I like their acknowledgment of this issue and the transparency aspect that it provides. A great solution for a possible ethical dilemma. 

In the last assigned source, an article going over both of these projects and the associated ethics behind historic visualizations is given. Similarly to what I prefaced earlier, it highlights the fact that the author uses intentional silences to promote their cause (ie: EJI and systemic racism).

Hepworth, Katherine & Christopher Church. 2018. “Racism in the Machine: Visualization Ethics in Digital Humanities Projects.” Digital Humanities Quarterly, 12(4). https://digitalhumanities.org/dhq/vol/12/4/000408/000408.html

This again shows the importance of digging into the data/sources used, the map itself, and the individual/group that made the map. Different symbology, scales, classifications, colors, and other cartographic elements can be used to alter data in a way that it should not be. While the sole point of maps is to create and maintain a proposition, they should not be used to falsely promote a point for argumentation’s sake. Mapmakers themselves should adhere to ethical standards, but in the fact that this is not always how it works, readers need to be given access to original sources and be aware of tricks/deceptions used to portray data.

Mapping Ecological and Economic Disaster

Geoff Confer’s “Pasture and Plows” argues that the “plowing of the Great Plains for crop agriculture did not happen quickly,” which is true to a certain extent. The Great Plains had existed for many centuries before European settlement. The colonization and technologies that they brought with them allowed for the plowing of the American west to be exacerbated which contributed to a significant loos in farmland and various ecosystems.

Before the introduction of the plow, American grasslands were much more abundant. Humans, expansion, and the environment obviously play a crucial part together. As more people were expanding westward, more of the grasslands were being plowed for agricultural uses as well as disappearing all together to created houses, schools, etc.

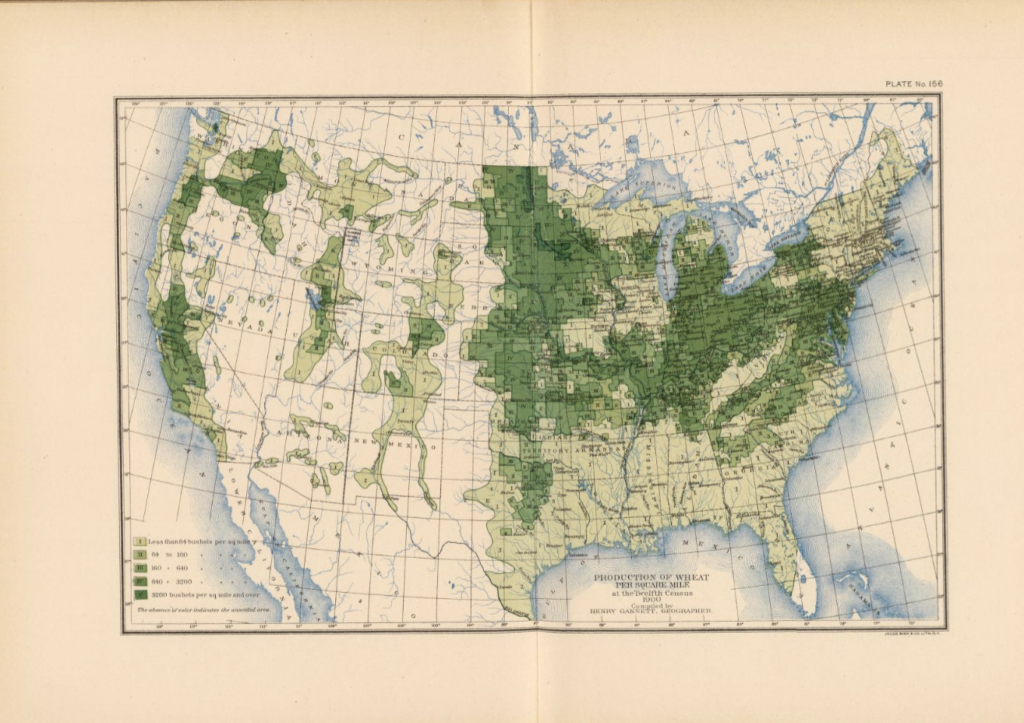
Henry Gannett’s map of the westerly plains shows that with the technological state of the 1900s, there is a clear limit to man’s ability to completely alter a landscape. As noted in the map above, we can see that there was some land that was unable to be stripped of its natural state and converted for agricultural use.

References

Cunfer, Geoff. 2005. On the great plains. Texas A&M University Press, pp. 16-37.

Gannett, Henry. 1903. “Production of Wheat per Square Mile at the Twelfth Census 1900.” DavidRumsey.com.

Mapping Disease

During the mid-1880s in London cholera outbreaks were taking over the city. London was growing rapidly and by 1851 it was the largest city in the world. Due to the sheer amount of people in such a small space, waste management, or lack there of, became a tremendous problem. This problem was amplified by the popularity of water closets and the lack of a functioning sewer system (Johnson, 12). Because of these problems, cesspools that contaminated drinking water were causing a massive cholera outbreak.

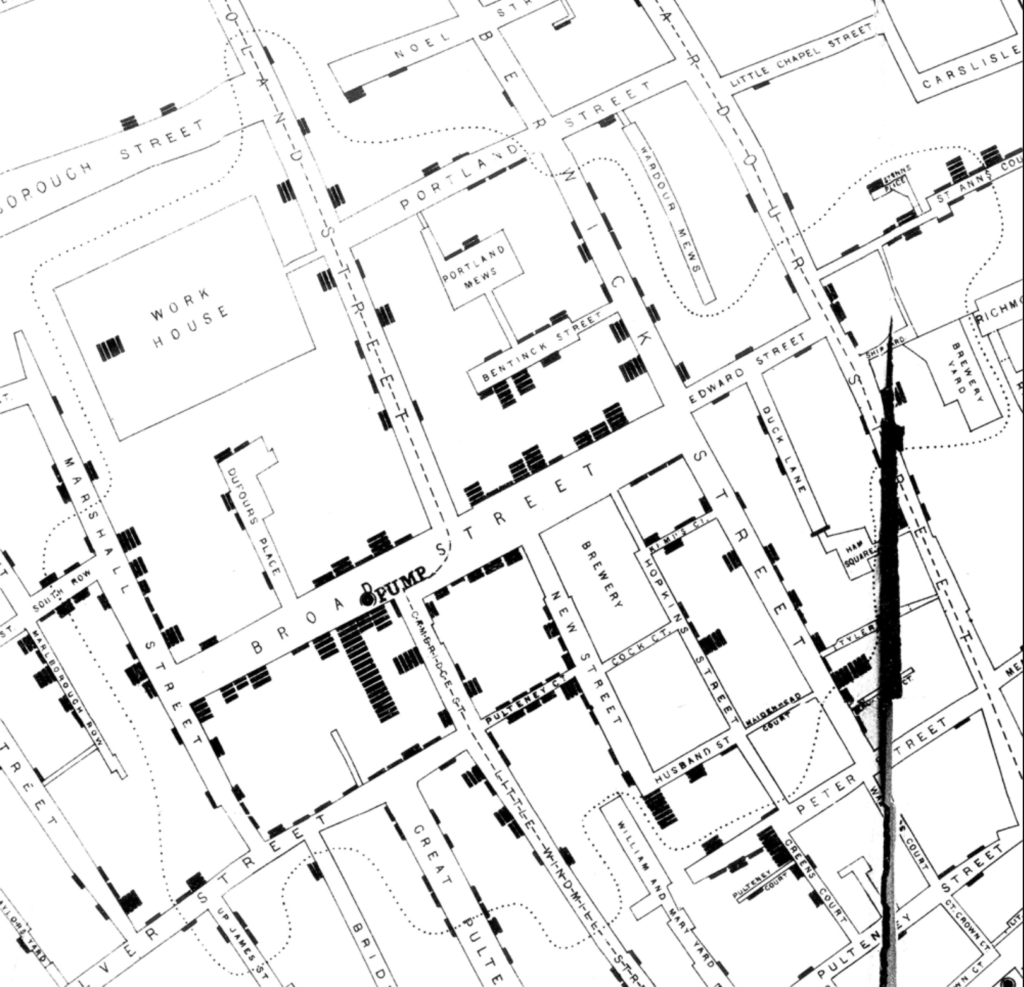
John Snow’s Cholera Map from 1855 uses a type of bar graph to chart the number of deaths surrounding the Broad Street water pump which was the main source of contaminated water. This map aided in the development of the theory of disease transmission through water. This theory was seen as ground breaking because many people had thought the disease was spread through the air, because of the horrible smell due to improper waste management.

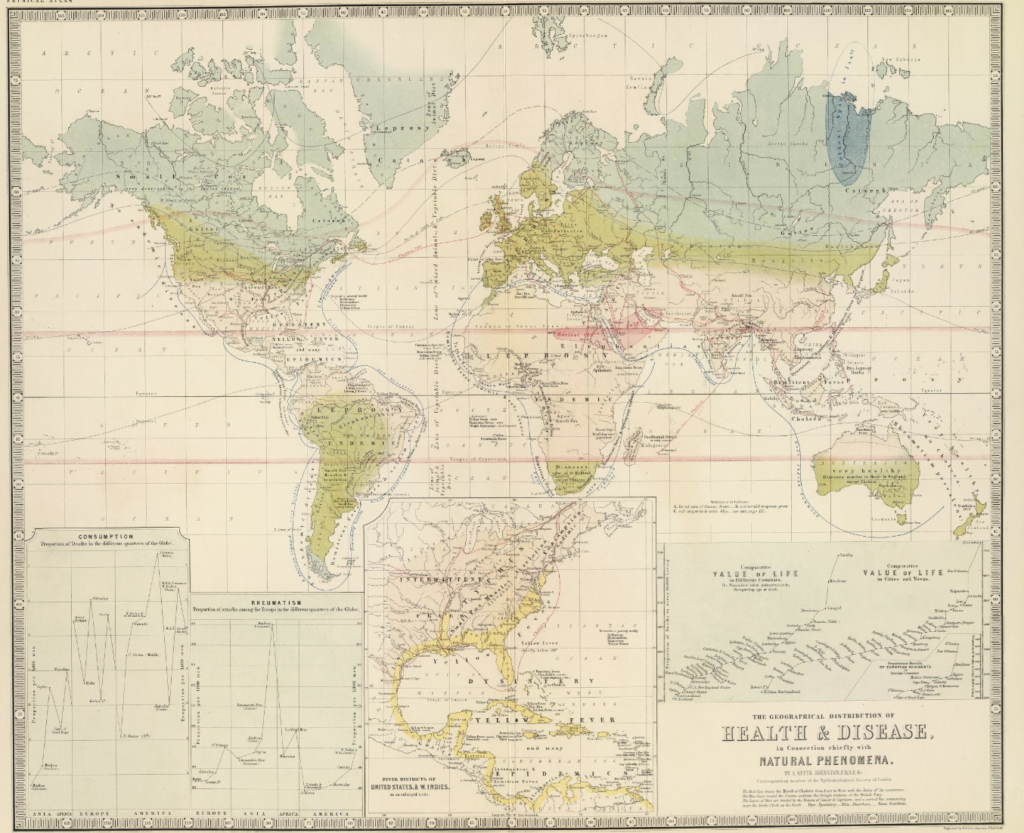
Alexander Johnston’s map the was produced a year after Snow’s, depicts the spread of disease on a global scale. Johnston attempts to link a natural phenomenon and disease transmission, he more or less links human movement and disease. This is very similar to the way Snow ties foot traffic around London to cholera contaminated drinking water.

Johnston’s map shows the British navy in blue and the routes they took around Africa and southwest Asia. It is noted that diseases are more widespread here than in places like Australia were the British had no contact at. I feel as though Johnston’s map would be easier to follow if he were to have focused on one disease, one color, and a wider area other than multiple diseases, multiple colors, and a smaller area. In my opinion John Snow’s map is easier to read and has created a better argument for the spread and progression of diseases.

References

Johnson, Steven. The Ghost Map: The Story of London’s Most Terrifying Epidemic — and How it Changed Science, Cities, and the Modern World. New York: River Head Books, 2006.

Johnston, Alexander. The Geographical Distribution of Health and Disease, in Connection Chiefly with Natural Phenomena. Edinburgh and London: William Blackwood and Sons, 1856. David Ramsey Historical Map Collection, https://www.davidrumsey.com/luna/servlet/detail/RUMSEY~8~1~24722~940061:The-geographical-distribution-of-he.

Snow, John. Cholera Map. 1855. https://kora.matrix.msu.edu/files/21/121/15-79-54-30-johnsnow-a0a1d5-a_16430.jpg.

Week 9 Blog – Evan Murphy

The rapid conversion of prairie and grasslands into farm land throughout the Great Plains region was the catalyst for greater migration into the region. Population growth in the plains is easily trackable when compared to when land was converted into farmable land which also helps explain North Dakota’s population being lower than that of Kansas by a decently large degree, having over double the people living in Kansas than North Dakota. North Dakota’s later conversion into cropland has increased it’s population over the past one hundered years.

The map of Wheat per Square Mile on David Rumsey is very interesting to me. As a Kansan born and raised I know there is a lot of wheat produced in Kansas and sometimes forget how much wheat is produced in other regions of the country. However, I will not focus on that observation and will focus on Kansas. Almost the entire state is dedicated farmland and an aggressive amount of wheat is produced. However, I am more interested in why wheat is not produced in great amounts in the other parts of Kansas. The South West corner of the state is less suitable for crops than the rest of the state so it’s low to non existent wheat numbers make sense. Many of the bordering areas to that region are rated as a 1 which I would assume is due to lower water availability as Western Kansas runs on ground water from the Ogallala aquafer. Many of the central regions are fairly urban and have less wheat production and there are a few notable specs of Flint Hill Grassland preserves.

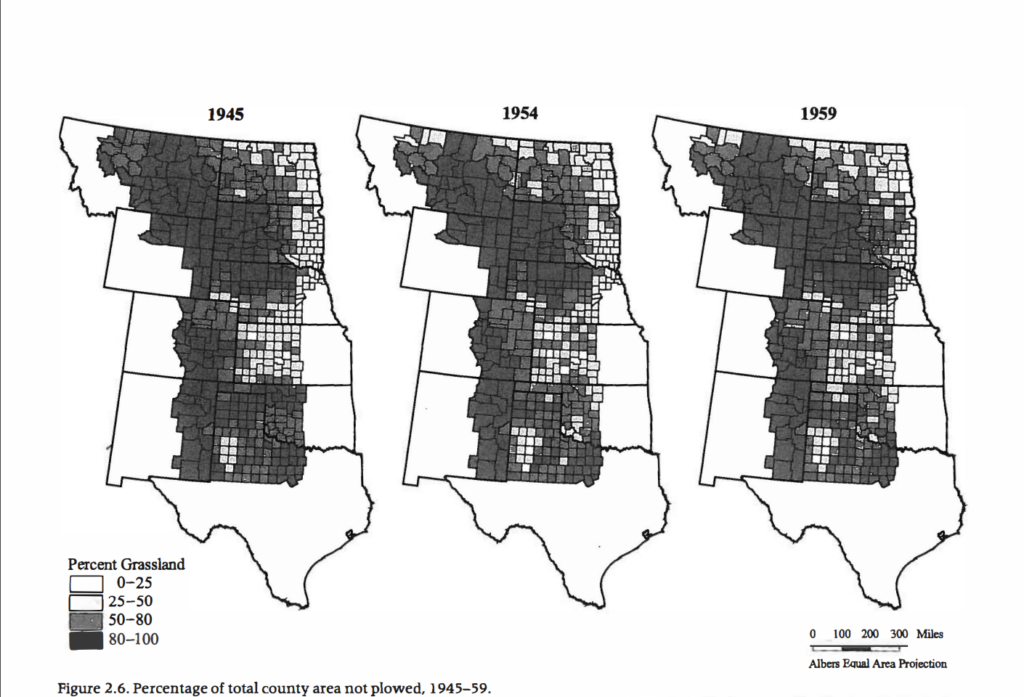
Figure 2.7 from the Cunfer reading displays how percent of grassland has changed over time. It seems that not much has happened since 1964 as far as grassland is concerned, but there are notable changes from 1945 to 1997. Why has there been little change over the past 80 years. Have there been new regulations put into place to reduce development or has it simply slowed down on it’s own?

Madeline King, Blog Post 9 – Mapping Tension Between Humans and Nature

The maps of the changes to the grasslands of the Great Plains demonstrate a mapping of the changing tension between humans and nature, and how that tension has developed with an influx of people and the creation of new technology within the last century and a half.

Henry Gannett’s map, 156. wheat/sq. mile, demonstrates the tension between humans and nature in 1903. In the western part of states like North Dakota, South Dakota, and Nebraska, there is a clear divide between land that is used for farming and land that is not. Geoff Cunfer explains several reasons for this task. Firstly, plowing the land to make the Great Plains suitable for farming was a slow task, taking decades for just one family’s farm to be plowed to a level that satisfied them (Cunfer, 18). The other, is that some land was not suitable for farming, even after being plowed – causing it to be turned back over and used for range land. There is a limit to human use of the land. This is a tension between nature and humans. Humans are attempting to exploit an ecological niche with technology, but nature can be unpredictable. Rain, rocks, elevation, and many other factors battled farmers from transforming the grasslands.

Cunfer’s figures continue to demonstrate the ever-changing tension between nature and humans. Humans have continued to attempt to turn the grasslands into something else, with the mapped divide from Gannett slowly being reduced throughout the decades. To do this, they utilized new tools, technologies, and techniques to better develop and maintain land for their needs. However, tensions between humans and nature come from several different sources, such as carrying capacity, natural resources available, suitable environments to live in, and the ability to successfully apply tools and technology to a sustainable development of land. What are the consequences from increasing the tension between nature and humans?

One example of disaster occurring from increasing the tension between humans and nature is actually one that occurred in the very region being mapped. This was the Dust Bowl of the 1930s. Humans experienced natural consequences of nature, like drought and poor production and decided to overproduce suboptimal land with new machinery (increasing tension). The drought and production caused soil erosion, which would plague the area in dust storms for a decade (further demonstrating the result of too much increased tension between humans and nature).

Bibliography

Cunfer, Geoff. 2005. On the great plains. Texas A&M University Press, pp. 16-37.

National Drought Mitigation Center. “The Dust Bowl.” University of Nebraska. https://drought.unl.edu/dustbowl/#:~:text=Due%20to%20low%20crop%20prices,would%20cause%20the%20Dust%20Bowl.

Gannett, Henry. 1903. “Production of Wheat per Square Mile at the Twelfth Census 1900.” DavidRumsey.com.

Sam Ellerbeck Blog Post 7: Mapping Rural Development

Henry Gannett’s 1903 map outlines the relative distribution of wheat production in the United States at the dawn of the 20th century. At first glance, one can see that much of the land that produced large sums of this crop was concentrated across the Midwestern regions of the country, whereas the Mountain West, West, and Southern lands of the United States did not contain high densities of wheat [2]. Gannett’s map, however, also serves a greater purpose – it offers a narrative about various environmental factors and it gives the audience a degree of insight into man’s ability (and inability) to manipulate natural landscapes.

In On the great plains, Geoff Cunfer describes the variation in land use between regions the central United States in the 19th and 20th centuries, highlighting the plowing efforts of many with their eyes set on agricultural profitability. To turn natural grassland into money-making fields of crops, there were a complex set of factors that needed to be just right. The land itself needed to be relatively level; enough rainfall was required for successful growth; temperatures needed to be mild enough to retain water in the soil, but consistent enough to have a lengthy growing season; and the soil itself must have nutritive substances. Each of these variables were required in the equation of making money in the agricultural realm, and any one that was missing would certainly detract from success [1].

Returning to Gannett’s map, we can begin to infer that areas with many bushels of wheat per square mile fit the slope, rain, temperature, and soil requirements necessary for profitable farming. Even though it only displays wheat per square mile, this map tells much more about the environments, weather patterns, and climates in specific areas of the United States. Prospective land buyers may have likely used this map as a tool to assess the environmental diversity across the country, basing their purchase of land on their intended use (farming or ranching, in particular).

Lastly, Gannett’s map shows that, given the technological state of the 1900s, there is a clear limit to man’s ability to completely alter a landscape. Not all land can be stripped of its natural state and converted into an economic and agricultural tool, as seen by the light-green and beige regions of the map. Further, Cunfer records that by the 1940s, farmers attempted to plow beyond the limit allowed by the natural environment, and much of what had been plowed eventually returned to grassland. Gannett’s map is a representation of the forces of nature versus the intent of man.

In terms of the final project, I think that the analysis of this map helps me to understand how, even though a map displays one particular thing, it can still be telling of a variety of other factors. In this case, even though Gannett only mapped bushels of wheat per square mile, the map still offers great insight into physical and environmental aspects of particular regions in the United States.

[1] Cunfer, Geoff. 2005. On the great plains. Texas A&M University Press, pp. 16-37.
[2] Gannett, Henry. 1903. “Production of Wheat per Square Mile at the Twelfth Census 1900.” DavidRumsey.com.

Gabe Murphy: Blog 7

In the US today, there is little to no land that is not currently serving a purpose. By this, I mean that nearly every acre is allocated to something: farming, homes, parks, state parks, cities, and all in between. Even land that has seemingly no function, is usually placed within a conservation easement of some sort; therefore, serving a purpose. However, in the time of Elam Bartholomew this was not the case. The prairies served an endless abundance of farmland, once rightfully plowed. Areas they determined were bad for farming, were mowed or left for grazing/hay. This was common:

Geoff Cunfer, “Pasture and Plows,” On the Great Plains, 2005; 19

Across the entire Great Plains, this transformation of natural grasses to pastures and farming was occurring: in what one described as the “most important ecological action” (Cunfer 17). Most importantly, the farmers discovered the natural limits of nature: something I believe science takes advantage of today. From 1880 to 1920, you can see the slow and tedious process of turning grassland into agricultural land:

Figure 2.4. Percentage of total county area not plowed, 1880-1920.

The eastern regions were targeted first, with subtle differences in large 20 year increments. Due to increased farming, demand for land, improved technologies, and an improved economy, the next fifteen years created immense change.

Figure 2.5. Percentage of total county area not plowed, 1925-1940.

When viewing the 1935 map, the change is greatly shown. The dark black map from the 1880s is now ~⅓ white, denoting 0-25% grassland in these areas (in other words a ~75% decrease in grassland!). By 1940, the resistance/limit set by the land is shown as the grassland returns in some areas. The author uses a choropleth map to maintain his argument, contrasting white and black which allows for an easy interpretation and visual of the change occurring. Sharing a similar argument, the 1903 map of wheat/square mile shows that eastern land was developed first and the Great Plains remained largely untouched until the 20th century. 

Henry Gannett, Wheat/sq. mile, 12th census of the US, 1903.

The dark green regions show the most bushels per mile2, while the white/unshaded regions represent the lowest amount of wheat production. Again, the mapmaker uses simple contrasting choropleths to show the argument. If this map were continued into the 1930s to 1940s, I presume it would show the same changes that Cunfers’ maps did–expansion and plowing of the Great Plains. The unshaded regions would become darker as the years passed and farming became more prevalent.

Sam Ellerbeck Blog Post 6: Mapping Disease

John Snow’s cholera map of 1855 was a tool that eventually aided in convincing London’s general public and health officials about the true nature of this mid-19th century disease outbreak. In its persuasion, the map generated downstream social and structural effects that stood as a precedent for disease prevention and health [1]. The cholera map recognizes disease closely connected to the ways in which communities interact, whereas Alexander Johnston’s 1856 “Geographical Distribution of Health and Disease in Connection Chiefly with Natural Phenomena” misses this point.

John Snow’s Cholera Map, 1855. [3]

Snow’s map (pictured above) not only displays recent incidents of deaths from this mysterious disease, but it also successfully depicts an understanding of proximity to the source of contamination – the Broad Street water pump. The map presents a very important connection between where cholera is occurring and why it occurs where it does. It understands that disease, or cholera in particular, has a reliance on the way humans interact with their environment. As in this case, people in close proximity to the contaminated water source were likely to become ill, as one would logically secure their water from a pump that is nearby.

Alexander Johnston’s map, listing diseases across particular areas of North and Central America. From DavidRumsey.com. [2]

On the other hand, Alexander Johnston’s global map of disease does not encompass this aspect of disease to the same degree. It seems to make an oversimplification of the idea of disease, arguing that disease is inherently regional or territorial. Specific diseases are listed across particular continents, which makes the implication that an illness is tied to distinct geographical areas. Additionally, by color-coding parts of this world map based on latitude, it attempts to make the case that things like weather or regional climate are a main factor in the spread of the shown diseases.

“Climate zones” depicted on Alexander Johnston’s map. From DavidRumsey.com. [2]

In sum, Johnston’s map does not effectively portray the interactive aspects of disease as well as John Snow’s map does. By drawing connections between proximity to the predicted source of contamination and understanding how that source became contaminated via human activity, Snow succeeded in setting a epidemiological standard that the spread of disease relies on how people interact with their environment. Johnston’s map, conversely, makes the case that disease is fundamentally embedded in specific regions of the world.

[1] Johnson, Steven. 2006. The Ghost Map. Riverhead Books. pp. 1-22, 190-228.
[2] Johnston, Alexander. 1856. Geographical Distribution of Health and Disease in Connection Chiefly with Natural Phenomena. https://www.davidrumsey.com/luna/servlet/detail/RUMSEY~8~1~24722~940061:The-geographical-distribution-of-he.
[3] Snow, John. 1855. Cholera Map. https://kora.matrix.msu.edu/files/21/121/15-79-54-30-johnsnow-a0a1d5-a_16430.jpg.

Madeline King, Blog Post 6 – Human Activity

The mapping of the spread of disease, such as that done by John Snow in 1855 or Alexander Johnston in 1856, shows or implies more than just the presence of disease. It also shows human activity. While disease does not just impact humans, also afflicting plants and animals, the mapping of human disease demonstrates how human activity has contributed to, or has been interrupted by, spreading disease.

Snow’s 1855 map demonstrates human activity. In the decades leading up to the Cholera outbreak, the infrastructure in and around Broad Street was designed to keep people of different economic classes apart from each other (Johnson, 20). Accessing water, a human activity, was predetermined by how easy this previous designing of paths and streets was completed. When Snow added the Voronoi diagram to his map, demonstrating the walking access residents in the area had to water from Broad Street and other sources, he demonstrated how it was the human activity of accessing the nearest source of water that contributed to cholera deaths (Johnson, 197). While other pumps might have been physically closer for some, Broad Street was more accessible.

I read the entirety of The Ghost Map (2006) as a common read for the CCAS Dean’s Fellows program my freshman year. One of the topics I remembered from this book was that when plotting the cases of cholera, there was an outlier. A woman who seemed to have no easy connection to the broad street pump had died of Cholera. It was later revealed that her sons, the Eley brothers, had been sending her water from Broad Street so that she did not have to fetch it herself (Johnson, 81). Mapping caught this abnormality. What may have once looked like an outlier, was now connected to Broad Street due to the human activity of sons caring for their mother.

Johnston’s map of disease also shows human activity. Several of the lines and plots on this map show the action of the British military (especially the navy).

While the map is attempting to conflate disease with natural phenomena, tracing the human activity of the British Navy demonstrates that natural phenomena is not all that is at work. Just as smallpox spread with the arrival of Columbus and other groups, such as the Conquistadors in the new world, the increased human interaction of groups across the world impacts the spread of disease. The worldwide presence of the British military also meant a worldwide spread of British diseases.

Bibliography

Johnson, Steven. The Ghost Map: The Story of London’s Most Terrifying Epidemic — and How it Changed Science, Cities, and the Modern World. New York: River Head Books, 2006.

Johnston, Alexander. The Geographical Distribution of Health and Disease, in Connection Chiefly with Natural Phenomena. Edinburgh and London: William Blackwood and Sons, 1856.

Snow, John. Cholera Map. 1855. https://kora.matrix.msu.edu/files/21/121/15-79-54-30-johnsnow-a0a1d5-a_16430.jpg Accessed on Feb. 25, 2024.

css.php