
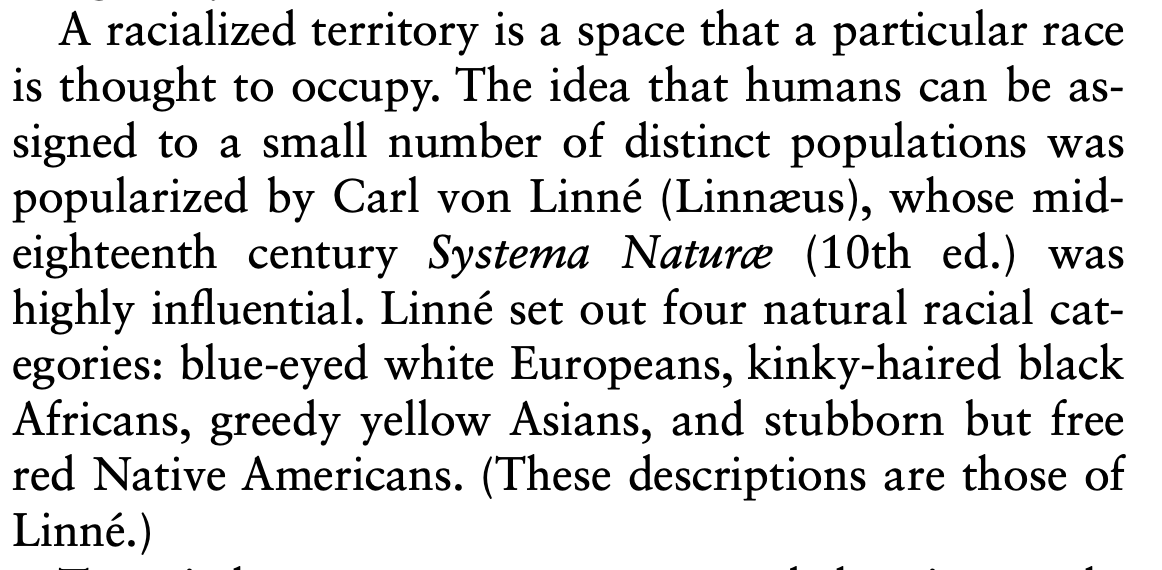
While maps set out to depict a constructed sense of reality of the world, they also have the ability to shape this reality. One example of this is seen through race and how maps have shaped different racial identities and regions. The idea that “a racialized territory is a space that a particular race is thought to occupy” was brought around through the work of Carl von Linné’s Systema Naturæ. It laid the groundwork for grouping people into racial groups which paved the way for racialized maps that would follow.
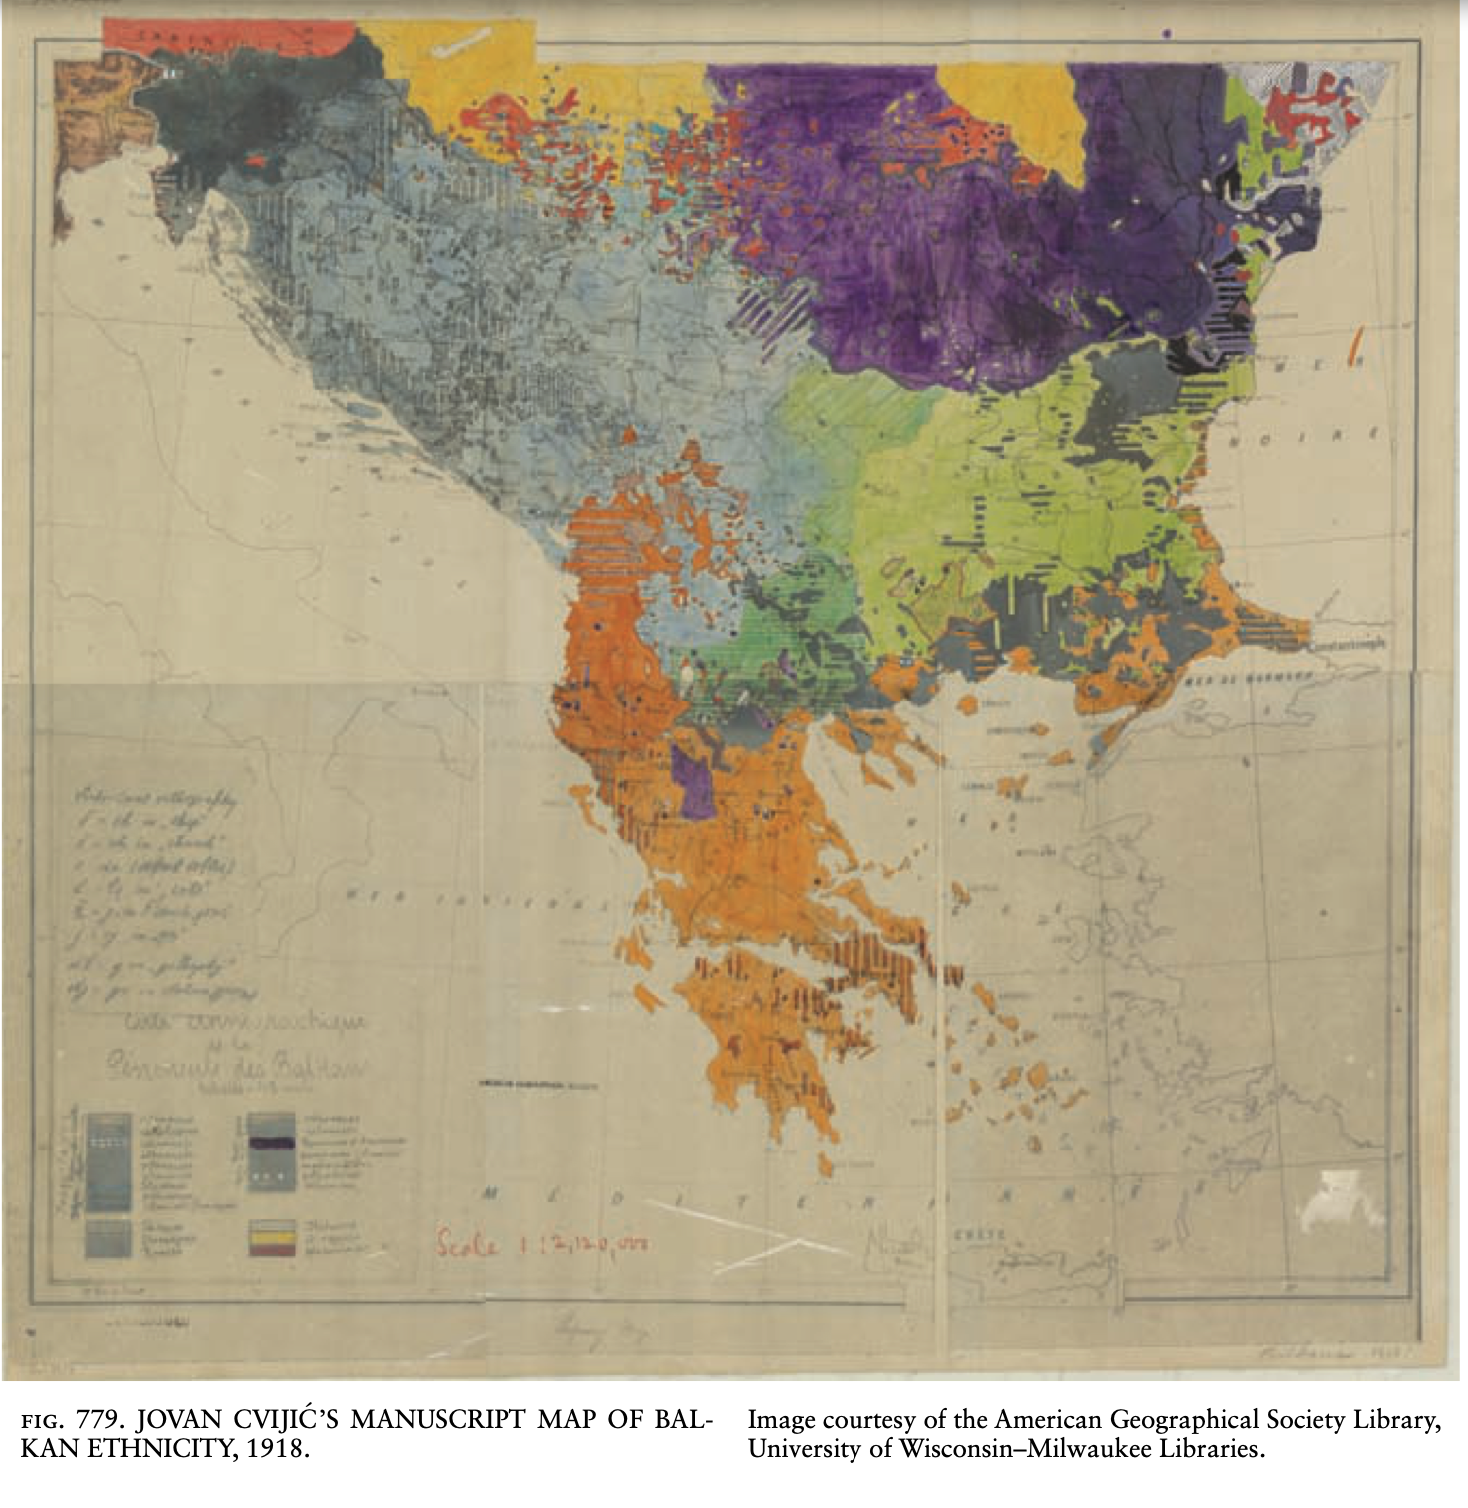
Maps can also wield power and strengthen systemic racism within countries. An example of this can be seen through redlining in the 1930s-40s. Another shift occurred after World War II as geographers and historians gained an understanding of how history, culture, and biology interact across space and identity. While reading this, a modern-day example came to mind of how colonialism shaped the current nation-states of Africa or the Balkans. The modern borders were set into place by Western powers and paid little attention to the different ethnic and religious groups across the continent, leading to messy borders. This is just one example of how geography is not the only predictor for maps and how there must be a coherent understanding of the interplay between history, culture, and biology when drawing borders.
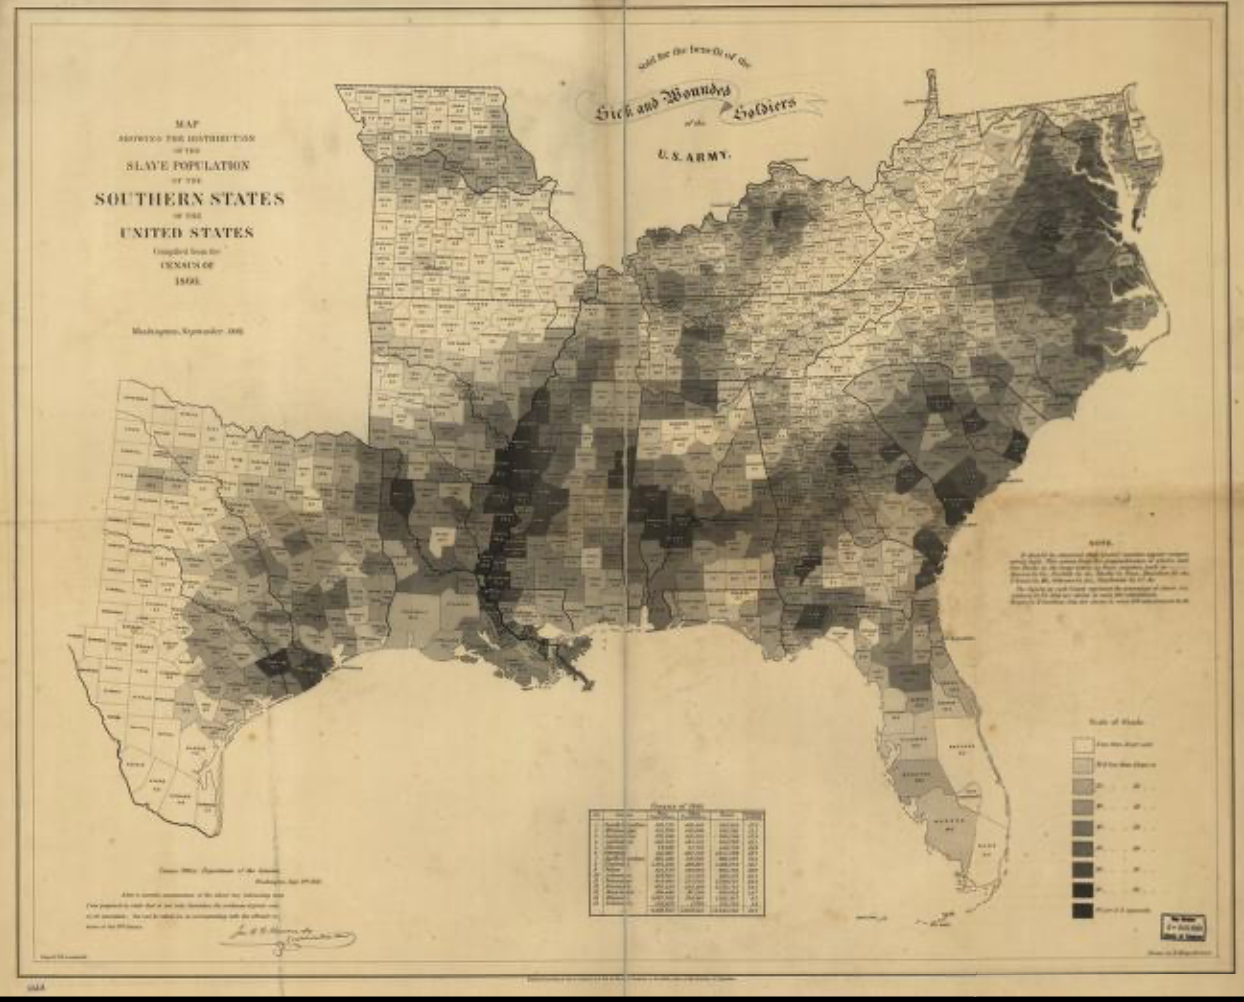
A similar example to this can be seen in the map below created by Edwin Hergesheimer. The map intends to show the slave population by county in the Southern United States, however when digging deeper, the reader can learn much more about how depicting race in this way can explain other phenomenons. Interesting to note is that the predominately darkly shaded countries across Alabama and Georgia have historically fertile soil which is an explanation for the forceful settlement of slaves in the region. However, when looking at this map in the context of today’s political scene, these same counties continuously vote blue. This shows how maps have played a pivotal role in creating racial territories and identities.
By acknowledging the role that maps play in shaping these identities and territories based on race, as a society we can work away from this system of inherent power and privilege.
Map Showing the Distribution of the Slave Population of the Southern …, www.loc.gov/resource/g3861e.cw0013200/?r=-0.189,0.02,1.249,0.704,0. Accessed 9 Feb. 2024.
R Race, Maps and the Social Construction of. The, press.uchicago.edu/books/HOC/HOC_V6/HOC_VOLUME6_R.pdf. Accessed 9 Feb. 2024.
“Races of the World and Where They Live.” Races of the World and Where They Live – David Rumsey Historical Map Collection, www.davidrumsey.com/luna/servlet/detail/RUMSEY~8~1~291599~90063129:Races-of-the-world-and-where-they-l?sort=Pub_List_No_InitialSort%2CPub_Date%2CPub_List_No%2CSeries_No&qvq=q%3Arace%3Bsort%3APub_List_No_InitialSort%2CPub_Date%2CPub_List_No%2CSeries_No%3Blc%3ARUMSEY~8~1&mi=45&trs=216. Accessed 9 Feb. 2024.
Very well done. “This is just one example of how geography is not the only predictor for maps and how there must be a coherent understanding of the interplay between history, culture, and biology when drawing borders.” – great use of Crampton to interpret the Hergesheimer map. Though where is the Field museum map???