


These maps depict change over time between 1880 and 1940, specifically showing a general spread of cultivation from east to west.
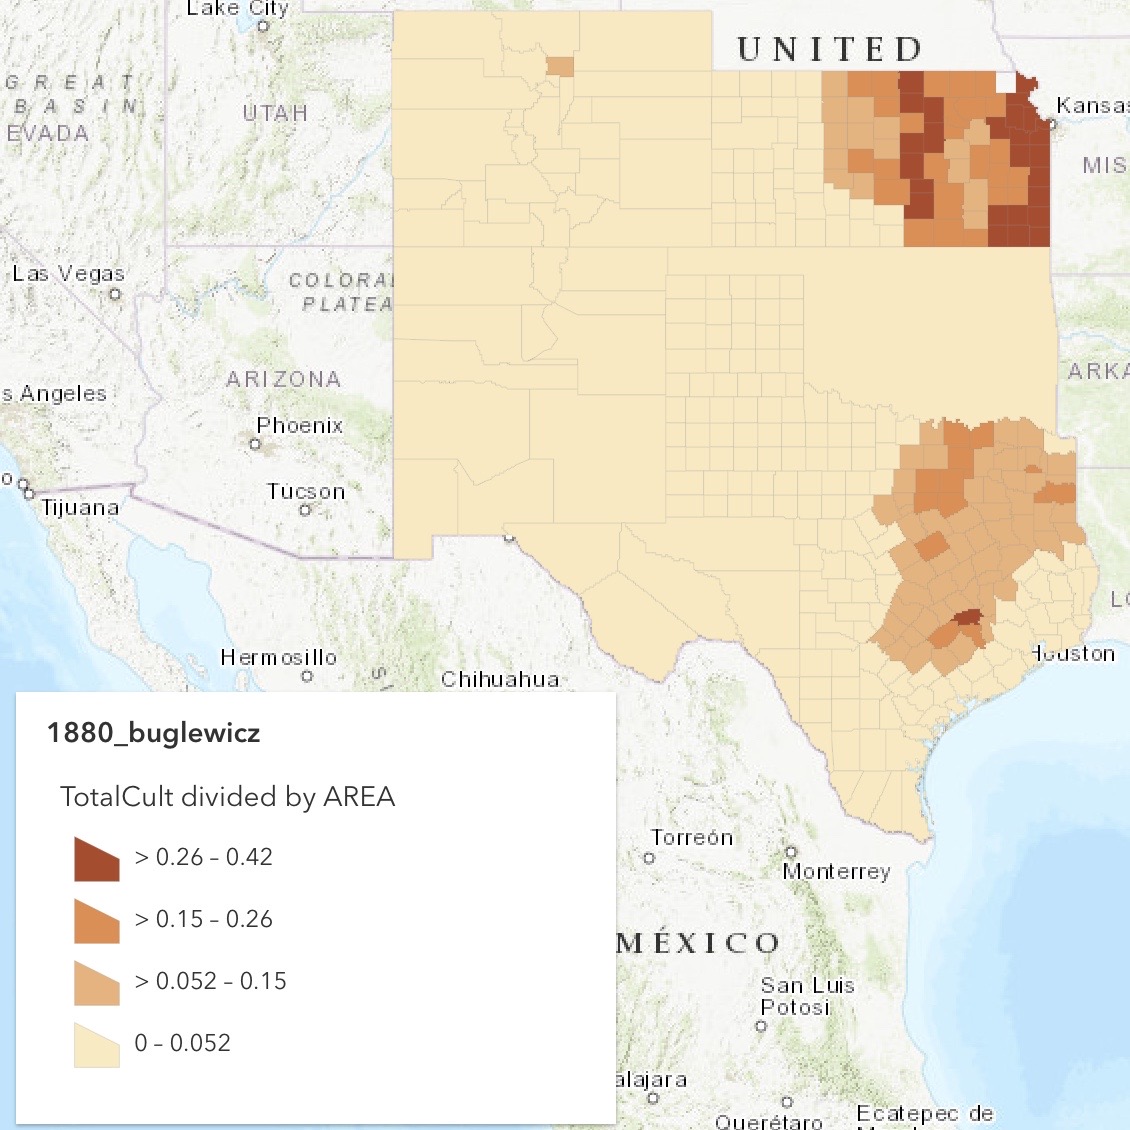
The first map, showing the land in 1880, has the least amount of cultivated land. At most, some counties were only 26-42% cultivated. The cultivated land is largely concentrated in eastern and central Kansas and eastern Texas, but those counties in Kansas have a higher percentage of cultivated land as indicated by the presence of the many dark orange counties.
The 1900 map shows a significant change because it has Oklahoma’s counties drawn and represented whereas on the 1880 map, they were absent. The land in Oklahoma now shows some cultivation at this point in time. The map’s legend notes another important change. This map has counties with the highest percentage of cultivation, between 44-66%. By 1900, Kansas had undergone greater cultivation and had the most highly cultivated counties in that range (shown in dark orange). This marked the time when farmers were finding the limits to how much land they could cultivate.
Overall, the 1940 map shows more widespread cultivation across the counties shown. It is easy to see the spread of cultivation from east to west since the map depicts an increase of cultivated land in Colorado, Texas, and Oklahoma. However, the darkest shade on the legend of the 1940 map only indicates 37-66% land cultivation, which shows that the limits were reached and farmers had to reduce how much land they cultivated to find a more sustainable equilibrium.
nicely done!