

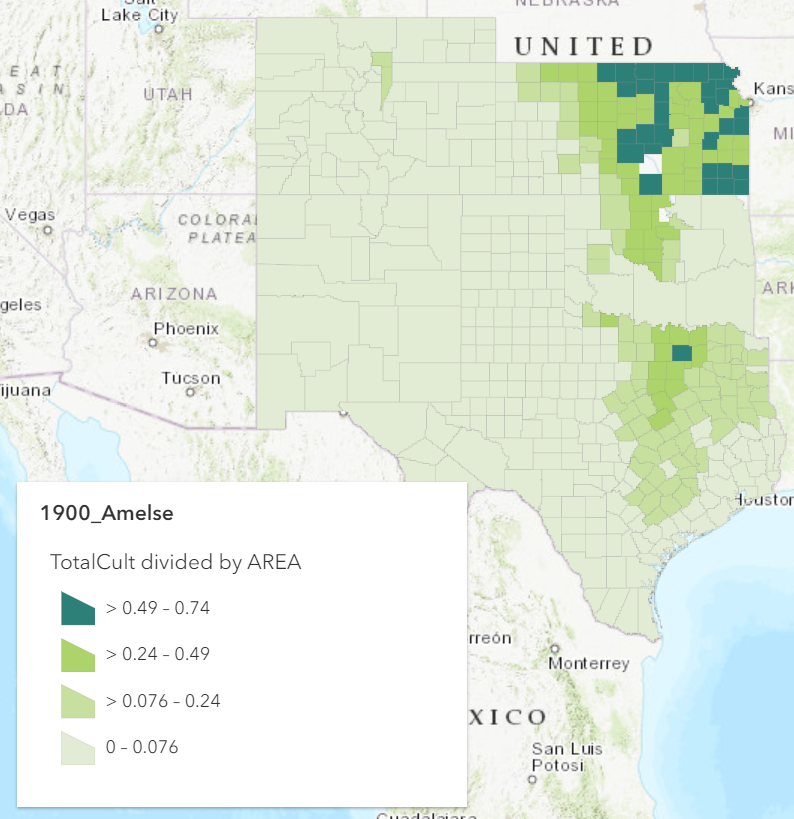
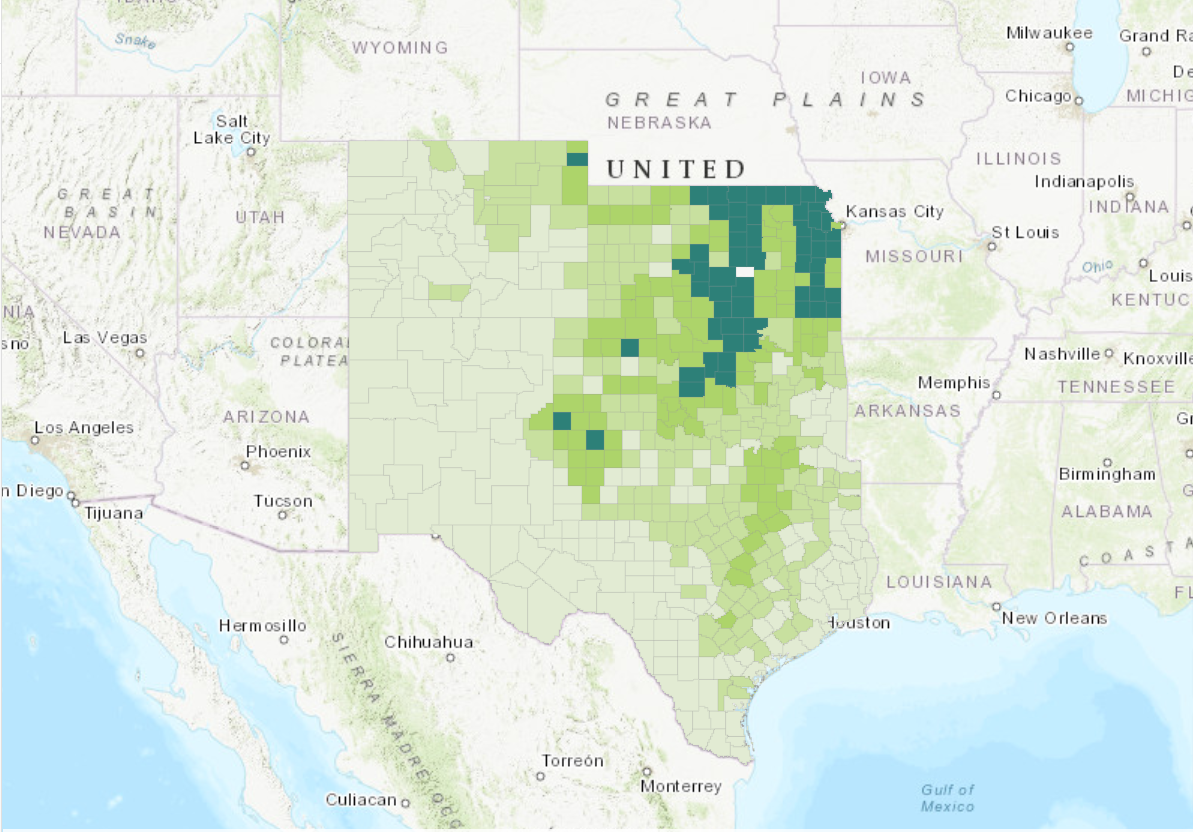
The most obvious key changes that I noticed was how they started collecting the data for Oklahoma in 1900. From no data to using data and splitting the state into counties supplies a contrast in the images. An important detail I noticed was the differences in how the classes of percents are split up. It gets larger in the transition from 1880, but then decreases again in the transition to 1940 it decreases again. I wonder what the maps would look like if the breaks were standardized through the years. Aside from that, another key change I noted was how the cultivation spread, especially towards the west as the decases went on. New ground was being cultivated in subsequent years.
Nicely done.