
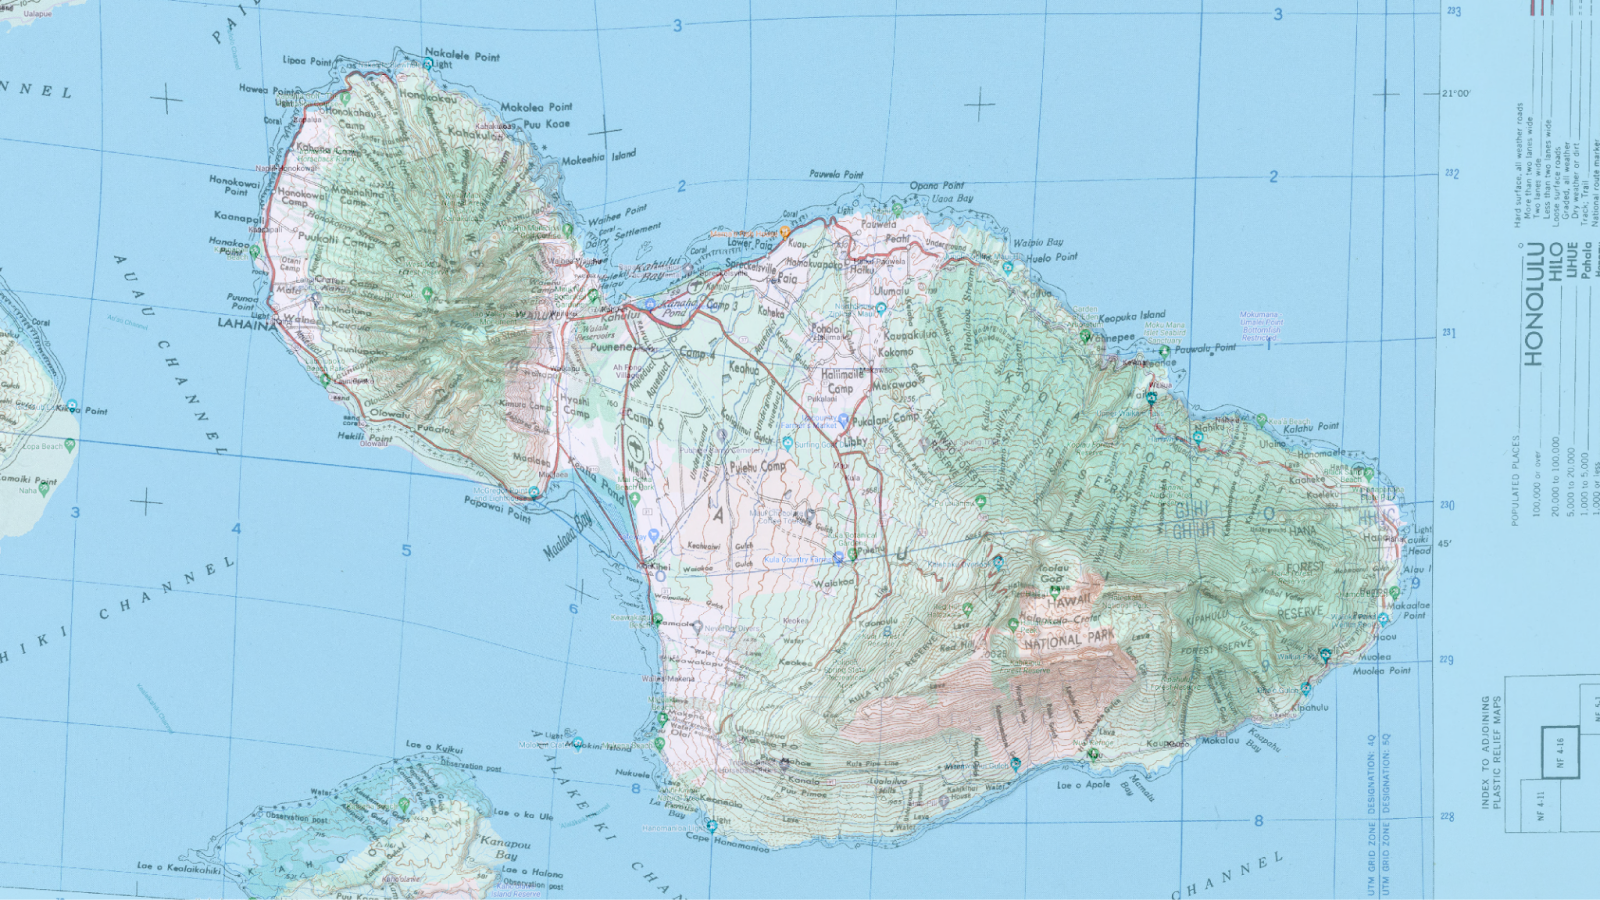
Overlapping multiple layers of maps can be very beneficial: in this case, and many other examples, I believe it is best used to experience/note change over time. The layered map (sitting on top of the google map base) has Haleakala National Park of Hawaii labeled in red. Over 60 years later, it would be very easy to indicate either the expansion of such reserve or the decrease in size. I would hope the reserve has increased in size from the 1962 map as maintenance and preservation of biodiversity grows in importance. Second, as ice caps begin to melt and ocean levels rise, this map would provide great insight into this change as depths and contour lines of shoreline/reef structures are highlighted. This could help to examine change over time as climate conditions continue to shift. The red lines highlight, what I presume to be, the main highway that encompasses the island of Maui. There would be a great change in this system as infrastructure seems to be on an exponential expansion destroying everything in its path.
As different maps undoubtedly have different scales, this scaling may throw off the true shape of the location the map focuses on. When this occurs, it may make it hard to accurately overlay two maps and ensure that one point on one lines up with one on the other. Further, as technology advances the accuracy of mapping does as well. When comparing a map from 60+ years ago, as I did, to a never-ending data mine (google maps), there will definitely be some differences in borders, town locations, streets, etc. In this case, my map was created by the US Army so I believe their technology at the time would have been the most advanced, possibly not even available to the public. However, maps today are certainly more accurate than the best of the 1960s. This may make it hard to georeference one map onto another–simply based on inaccuracies and changes. As seen in my example, there is a stretch of highway running over the ocean in the bottom-middle region of the island; when in reality this does not happen. There was simply no way to accurately depict the entire shoreline, and this stretch took the biggest hit. Using 7 control points was not enough to layer these maps together, I had to use nearly 20–a definite weakness of this approach. I am wondering if there is a way to trace a border and layer them together by that–I feel like that would be a much more accurate, but tedious, method. Overall, I am satisfied with how the georeference came out: but it is certainly not a 1:1 scale.
Nice reflections Gabe!