The historical map I vectorized includes certain topographical features, including some peaks and mountain ranges. These are identified with names and images on the map, but lack clearly defined edges. Elevation gain is often gradual and uneven, so pinpointing exact borders to create a “mountain range” vector categorization could prove challenging. Compared to the surveyed county lines and crisply defined lake edges, the high regions of California lack the clear outlines necessary for easily drawing polygon vectors.
One useful attribute to add would have been ID numbers. This project called for only three vector layers, each with a relatively small number of features. However, adding ID numbers aids in organization and clarity when working with spreadsheet data. This becomes especially important for larger datasets (including hundreds or even thousands of individual features). In the case of my specific dataset, attributes like date or population could have been appropriate. For the features in my cities and towns layer (point vectors), I could add date of founding to provide insight into change over time. Adding population count (using data from the U.S. census most contemporary to the map’s creation) could provide insight into the population distribution of the state. Were I to create a new vector layer to identify whole counties, the population attribute could also be applied.
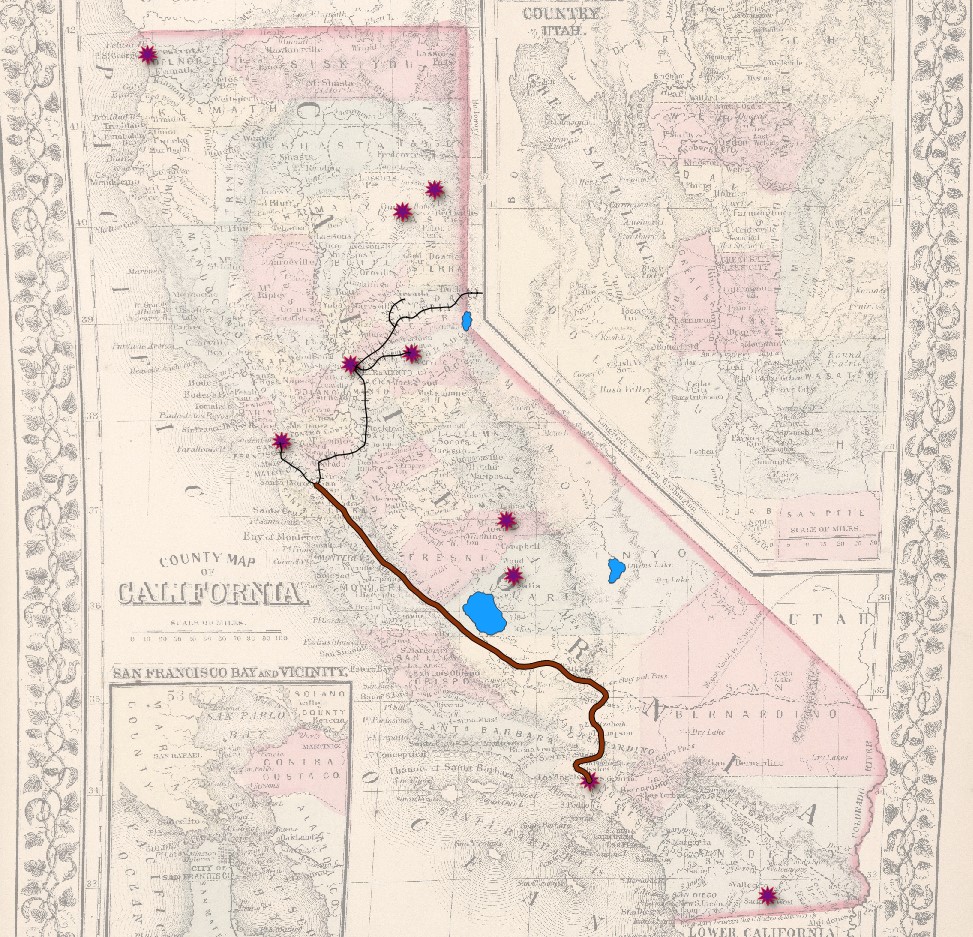
One relationship that stood out to me, as a Californian, is the difference in area between Lake Tulare and Lake Tahoe. Lake Tulare no longer exists, and I grew up traveling to Tahoe and imagining it as a large body of water. Vectorizing the lakes helped me to better visualize the true difference in size between them. Also enlightening are the line vectors identifying railroads and wagon roads. On the original map, these transit routes are often faded and hard to draw out with the eye. Adding bold vectors allows for easier visualization of the transportation networks of California in 1868. Highlighting features with vectors draws the attention of the audience, and presents the historical map in a new way that emphasizes key features. By adding vectors, I was better able to organize my thoughts and reflections on the historical map. I did not add totally new information, so much as drew out key features hidden within the complex historical map to facilitate their study.
One Reply to “Wyatt Greco Practicum 3: Building Vector Layers”
Nicely done, and I love your symbolization. It really makes the features pop.

Nicely done, and I love your symbolization. It really makes the features pop.