
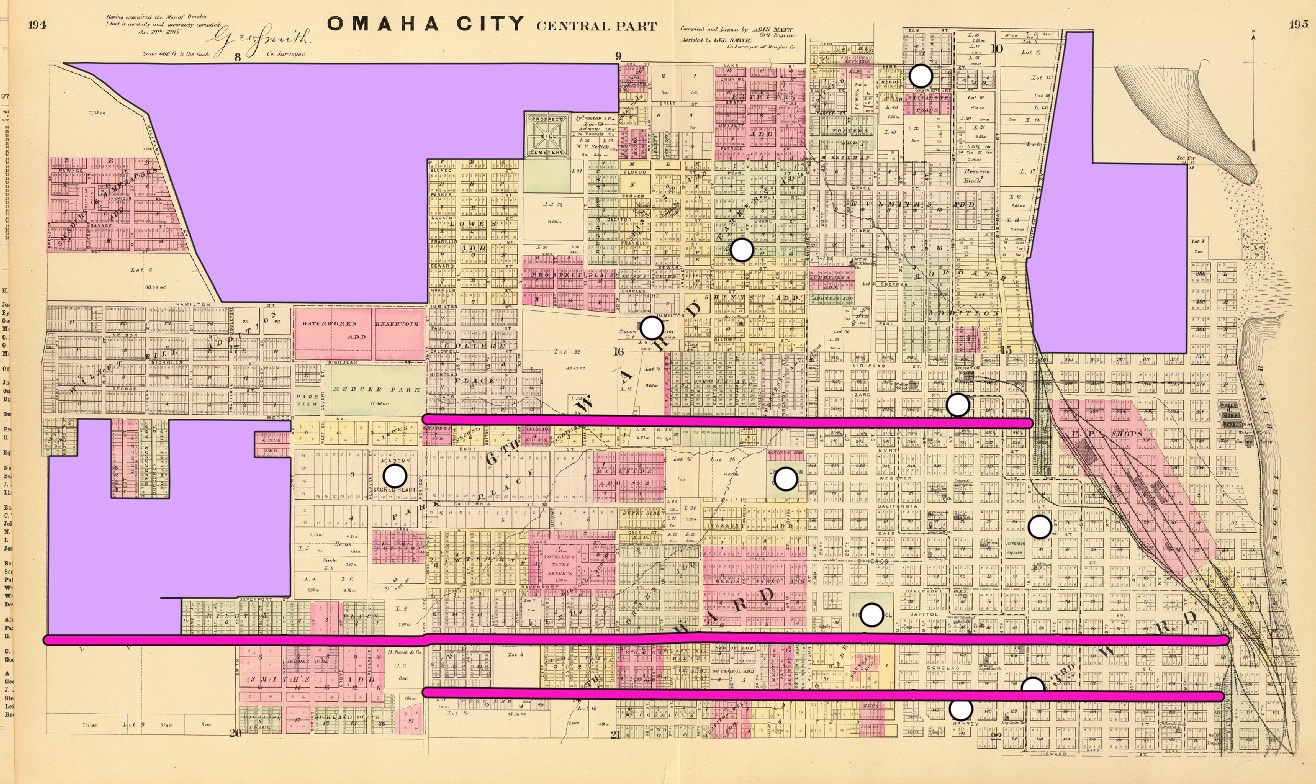
1. Are there any features on your historical map that would have been difficult to assign a vector categorization (point, line, polygon)? Why?
On the right side of the map, the Missouri River is depicted, but it is on the edge and varies in thickness. Therefore, I do not think that assigning any vector categorization to it would be easy. Another feature that may be difficult to reproduce on a vector map would be the railroads. On the map, they are very fine and intricate. The railroad lines intersect with each other, too. For these reasons, it would likely be difficult to assign a vector to them that would be both clear and effective.
2. What other attributes (aside from name) do you think would have been appropriate to add to your vector dataset?
There are many other attributes that could have been appropriate to add to this vector dataset. For example, I chose to assign polygons to empty lots. However, to make this more useful, the square footage and size of the lots may be attributes that should be considered. I also plotted buildings with points, but I think it would be important to indicate what type of building each one is, such as a school or church, and what year the building was established to show the growth and expansion of Omaha over time. Finally, I think that for all the vector categories which I chose to include (lots, buildings, and roads), the coordinates of these locations would be appropriate to add.
3. Did you detect any spatial relationships when digitizing your map that you would not have otherwise? Did you see your historical map in a new way? If so, how?
By digitizing this map, I became more aware of how many buildings there were because I had to zoom in and assign them a point. In doing so, they were easier to see on the map, and I noticed that there seemed to be less buildings near the empty, undeveloped lots. This makes sense as the city was still expanding at this time. Although I did not digitize them on the map, I also noticed the railroads more because they were near the more developed areas where I was plotting buildings and roads. As a result, this process just underscored the idea that in 1885, when this map was produced, Omaha was still developing, and this map shows some of the first foundations of the city.
Nicely done!