
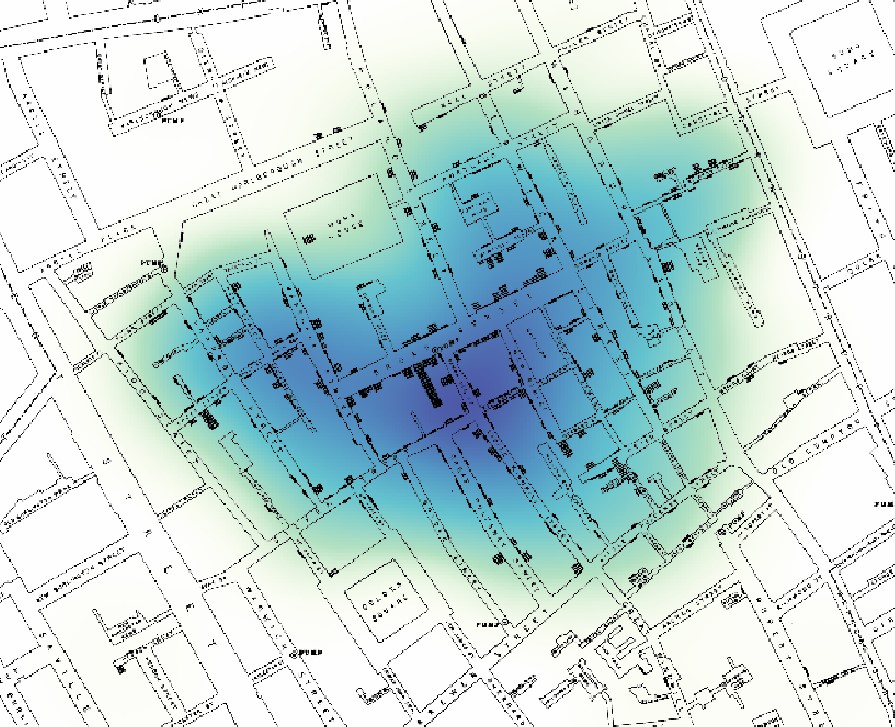
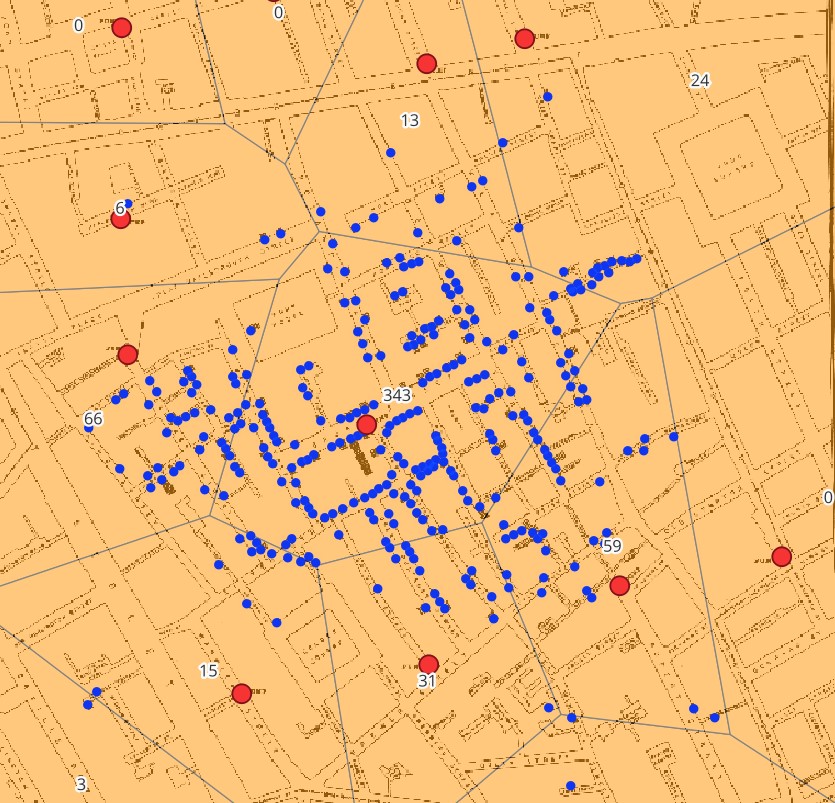
In studying the health effects of pollution from a particular source (say, a power plant or factory), a heat map could be used to analyze the spatial distribution of individuals in an area affected by cancers, respiratory ailments, or other conditions (depending on the type of pollution theoretically being emitted). I have also seen heat maps used to spatially analyze weather conditions, like temperature or precipitation. Such maps allow an audience to analyze both gradual change in weather and hotspots for a particular phenomenon (lowest temperatures, highest winds, etc.). As for Voronoi polygons, one use could be in an analysis of public schools and commuter students. A Voronoi diagram could be created for the schools in a city, while the home addresses of students for each school could be mapped by additional (non-Voronoi) points. This would reveal if school of attendance is truly determined by proximity, or if other factors may be determining which schools the residents of a city elect to attend.
In the context of my final project, Voronoi polygons in particular could prove useful. I plan to map major industrial production over history in the Rust Belt, studying its effects on the surrounding population and economy. Perhaps I could do so by identifying major sites of production (factories, mines, etc.), and then making Voronoi polygons emanating from these points. That way, even if a site of production is near a state line, I could be more likely to capture the potential labor force and communities who are connected to that site.
Nicely done!