
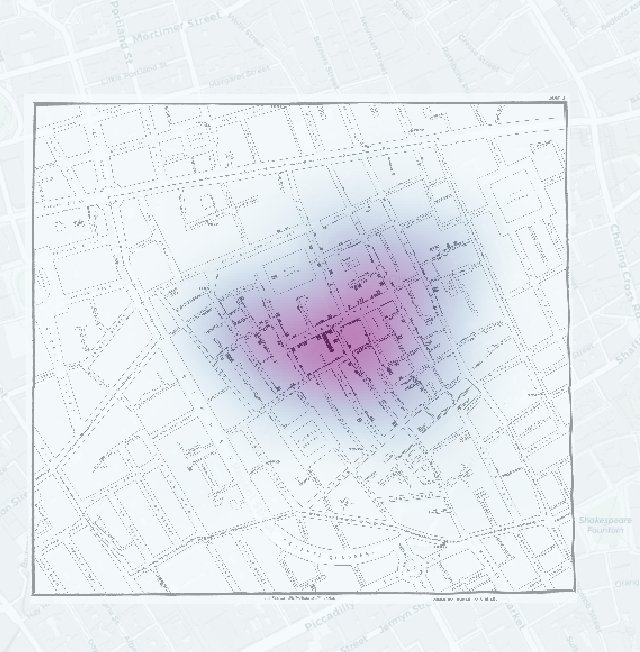
Heat maps are very powerful and useful tools, this week we were able to create one to map the density of mortality data during an epidemic. Another situations in which a heat map could be useful would be mapping the average salaries of people in an area, or even using them to map the weather and the severity of it, much like we see on the news.
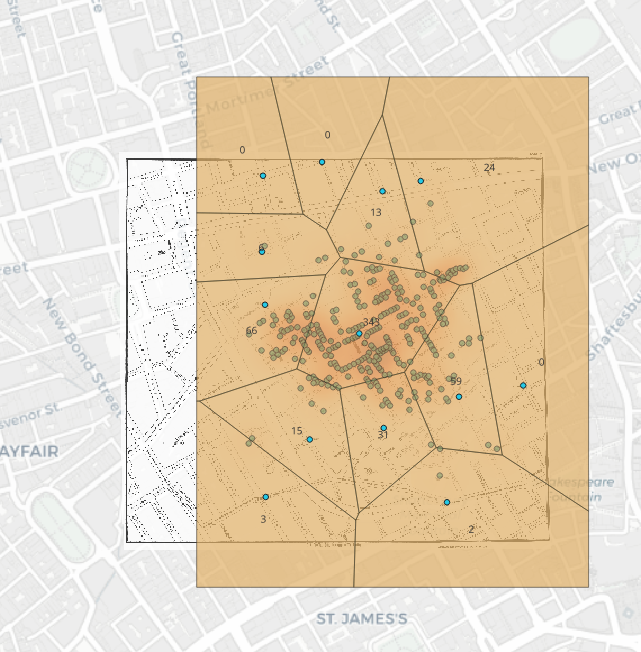
A voronoi polygon map can also be used for multiple different things. In class we saw that they were used for the mapping of states boundaries according to their capitals. Another use for voronoi polygons are the mapping of clusters of stars, analyzing different structures of plants, and mapping the amount of rainfall or snow a regions receives.
These tools will be very useful for my final project because I plan on expanding my knowledge of the 1980-1990s HIV/AIDS epidemic. I chose this topic for HIS 490 and loved doing the research and I had attempted creating a map of the data but I was unable to successfully create one that displayed what I wanted it to. I feel as though with this data I will be able to expand my knowledge, create a map, and find the data that I was unable to do before.
Categorize! Otherwise, nicely done