
For many years certain cartographers, eugenicists, and those with different political or economic motivations have mapped race in different ways. While a map may not explicitly state its purpose is to map race, the map may have an implicit goal of showing it. For example, the red lining maps between the 1930s and 1960s did not explicitly state it was mapping race, but it was used by corporation such as the Home Owners’ Loan Corporation to keep certain neighborhoods (predominantly of minority races) in poverty (1235).
The two maps below are maps that both map race, however, only one of them explicitly states that mapping race is its purpose.
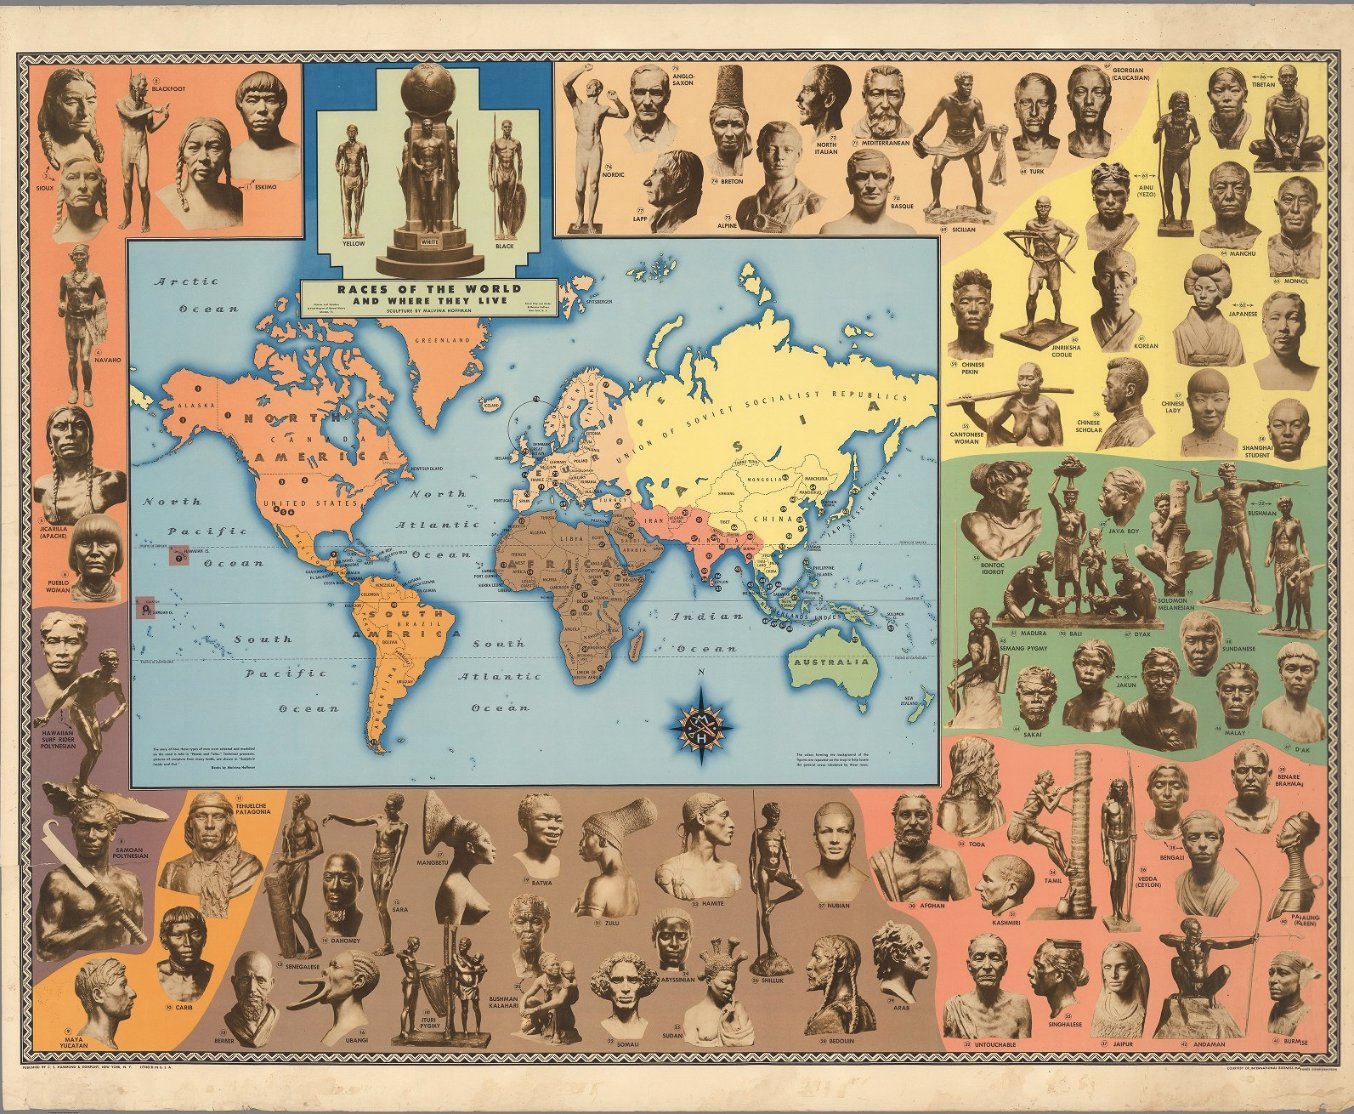
The ”Races of the World and Where They Live Map” explicitly states in its title that it aims to classify all races of the world and designate them into specific biological regions. Created by Malvina Hoffman and published by the C.S. Hammond & Co. in 1944, this map provides nine different (color coded) classifications for race and the region members of that race occupy. The map provides little to no social or cultural understanding of race and, despite its publishing year, leaves no explanation for cultural make up of mass immigration throughout the decades. This map is reminiscent of Carl Von Linné’s classification of race into four categories, namely the “blue-eyed white Europeans, kinky-haired black Africans, greedy yellow Asians, and stubborn but free red Native Americans (1232). This map only presents race as a biological and geographical fact.
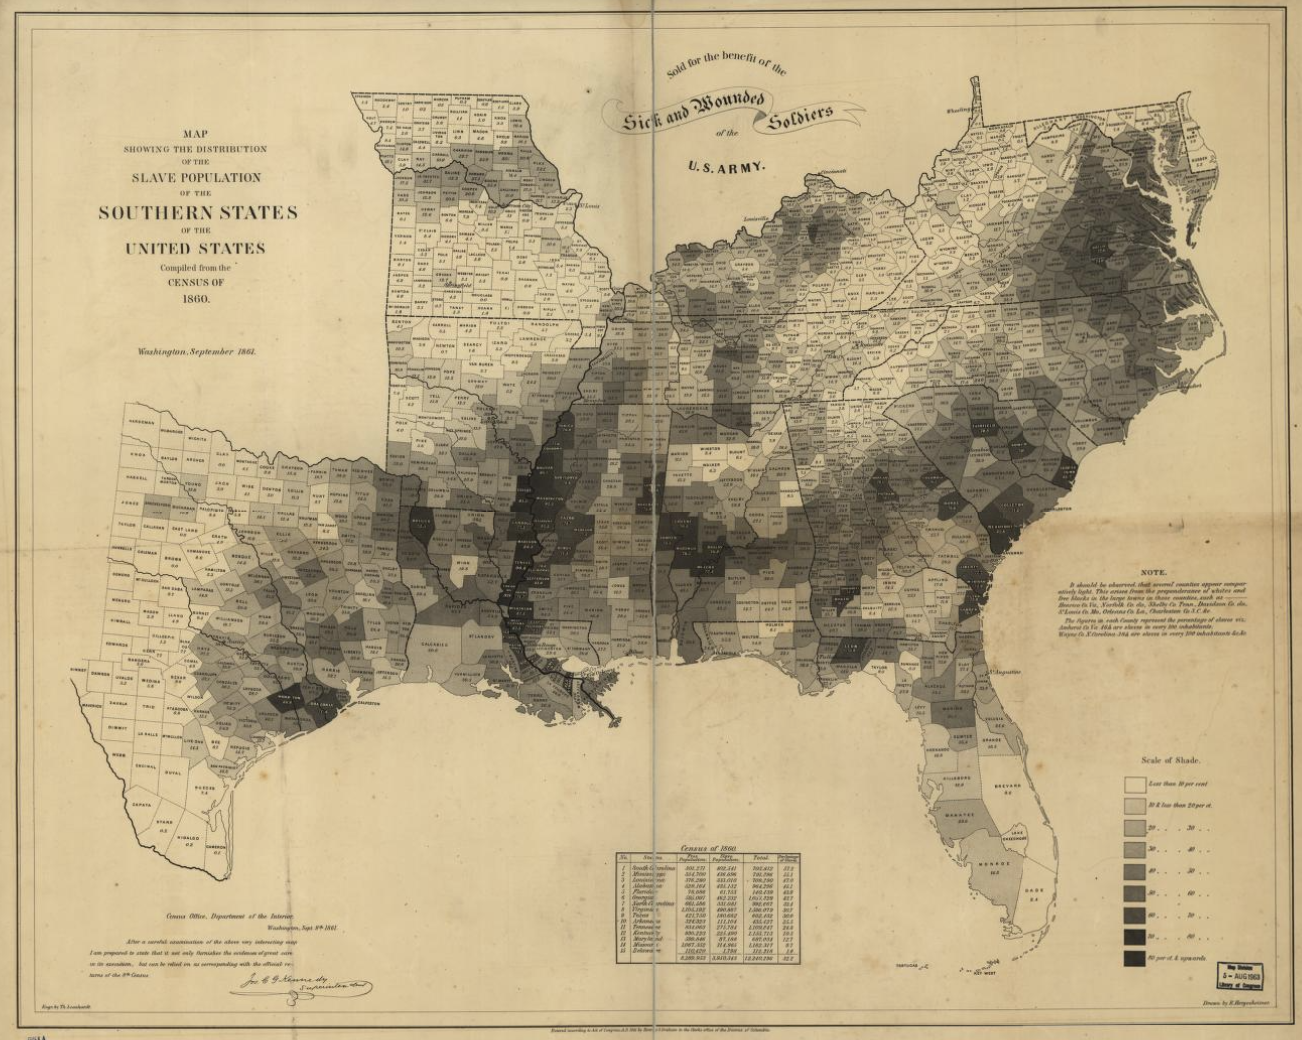
Despite not explicitly stating it is a map of race, the map “Map Showing the Distribution of the Slave Population of the Southern States of the United States”, undoubtably maps it. Following from Census Data, which in 1790, had Free White Males, Free White Females, all other Free Persons, and Slaves mapped as its categories, this map seeks to explain the breakdown of slaves in the United States, which despite not being explicitly states were almost entirely made up of one racial group (1233). The map also seems to attempt to clarify any misinterpretation of where certain races may reside in the United States with a note that says some areas only appear lighter than others, but that may be because there is a large preponderance of free blacks in the area.
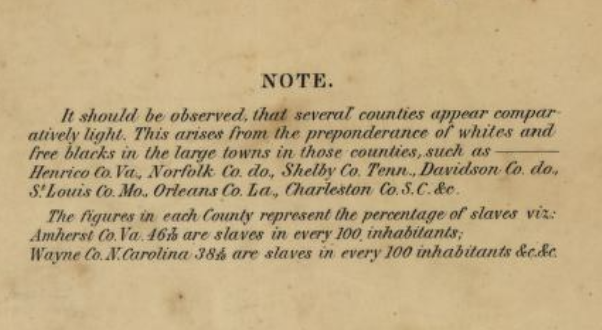
This map also attempts to clarify any misinterpretation of the map by noting that some areas only appear lighter than others because there is a large preponderance of free blacks in the area. This note further pushes the implicit goal of mapping race by seeking to not “mislead” anyone about who occupies what areas.
While the first and second map imply that they are doing different things, both map race and confine race into strict boxes (social or biological) that it does not necessarily fit in to.
Bibliography
Crampton, Jeremy W., “Maps and the Social Construction of Race,” in The History of Cartography, Volume 6: Cartography in the Twentieth Century, ed. Mark Monmonier (Chicago: University of Chicago Press, 2015), 1232-1235.
Hergesheimer, E. Map showing the distribution of the slave population of the southern states of the United StatesCompiled from the census of. Washington Henry S. Graham, 1861. Map. https://www.loc.gov/item/99447026/.
Hoffman, Malvina. Races of the world and where they live. 1944. David Rumsey Map Collection. https://www.davidrumsey.com/luna/servlet/detail/RUMSEY~8~1~291599~90063129:Races-of-the-world-and-where-they-l?sort=Pub_List_No_InitialSort%2CPub_Date%2CPub_List_No%2CSeries_No&qvq=q:race;sort:Pub_List_No_InitialSort%2CPub_Date%2CPub_List_No%2CSeries_No;lc:RUMSEY~8~1&mi=45&trs=216#.
Excellent job – very well written and argued (even incorporating a small reflection on redlining, more on that next week). Clear and concise. no notes!