
- Are there any features on your historical map that would have been difficult to
assign a vector categorization (point, line, polygon)? Why?
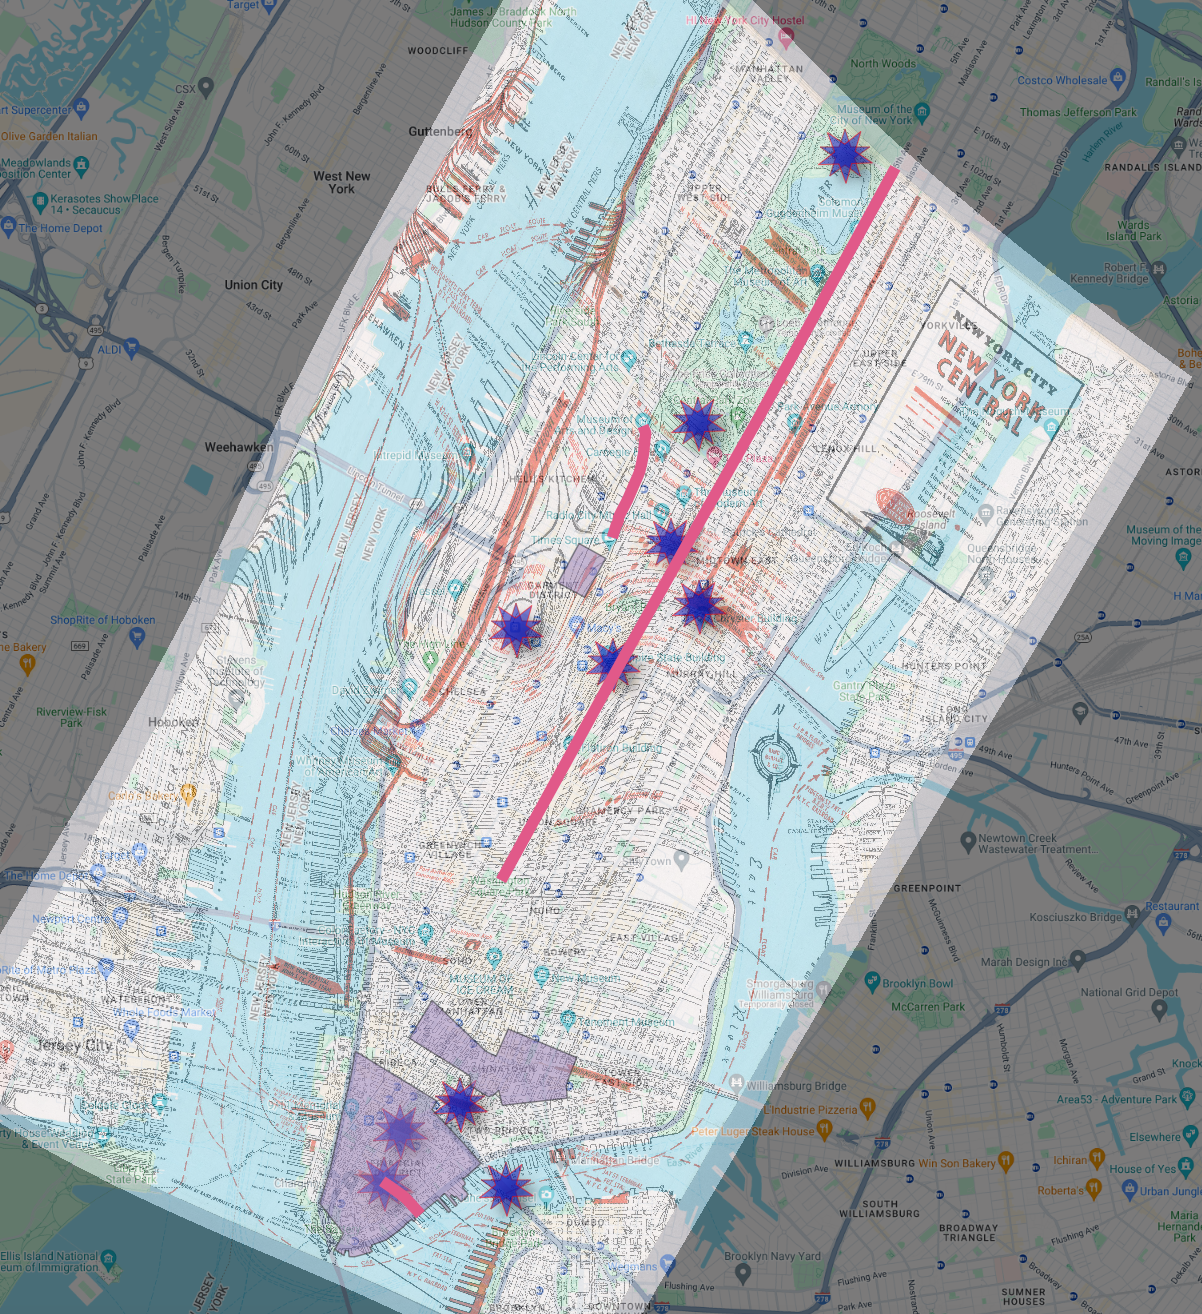
I think some of the areas like Madison Square Garden, and the Rockefeller Center could have been hard to vector categorize as polygons. Both of those places are very popular areas in New York City, but both of them are very small areas, and they could have been hard to see with how large the map of New York City I chose is. Also, the area on the Google Maps and the area on the historical map were warped a little bit, so it would have been hard to find the correct area.
- What other attributes (aside from name) do you think would have been
appropriate to add to your vector dataset?
I think another attribute I could have added would be the Boroughs that are scattered around New York City. The areas of the Bronx, Harlem, Manhattan, Brooklyn, Queens and Staten Island were places that I thought about after I had already vector categorized The Financial District, Chinatown, and Times Square.
- Did you detect any spatial relationships when digitizing your map that you
would not have otherwise? Did you see your historical map in a new way? If so,
how?
I noticed that 5th Avenue, which is right next to Central Park, towards the top of the map, was the exact same on both maps. When thinking about which streets to add lines to, I noticed that, so that was pretty surprising.
Nicely done!