
In a post-pandemic world, we know understand, and can visualize the rapid spread of disease on a global scale. However, in previous centuries, the mapping of disease and its movement was a much more important practice.
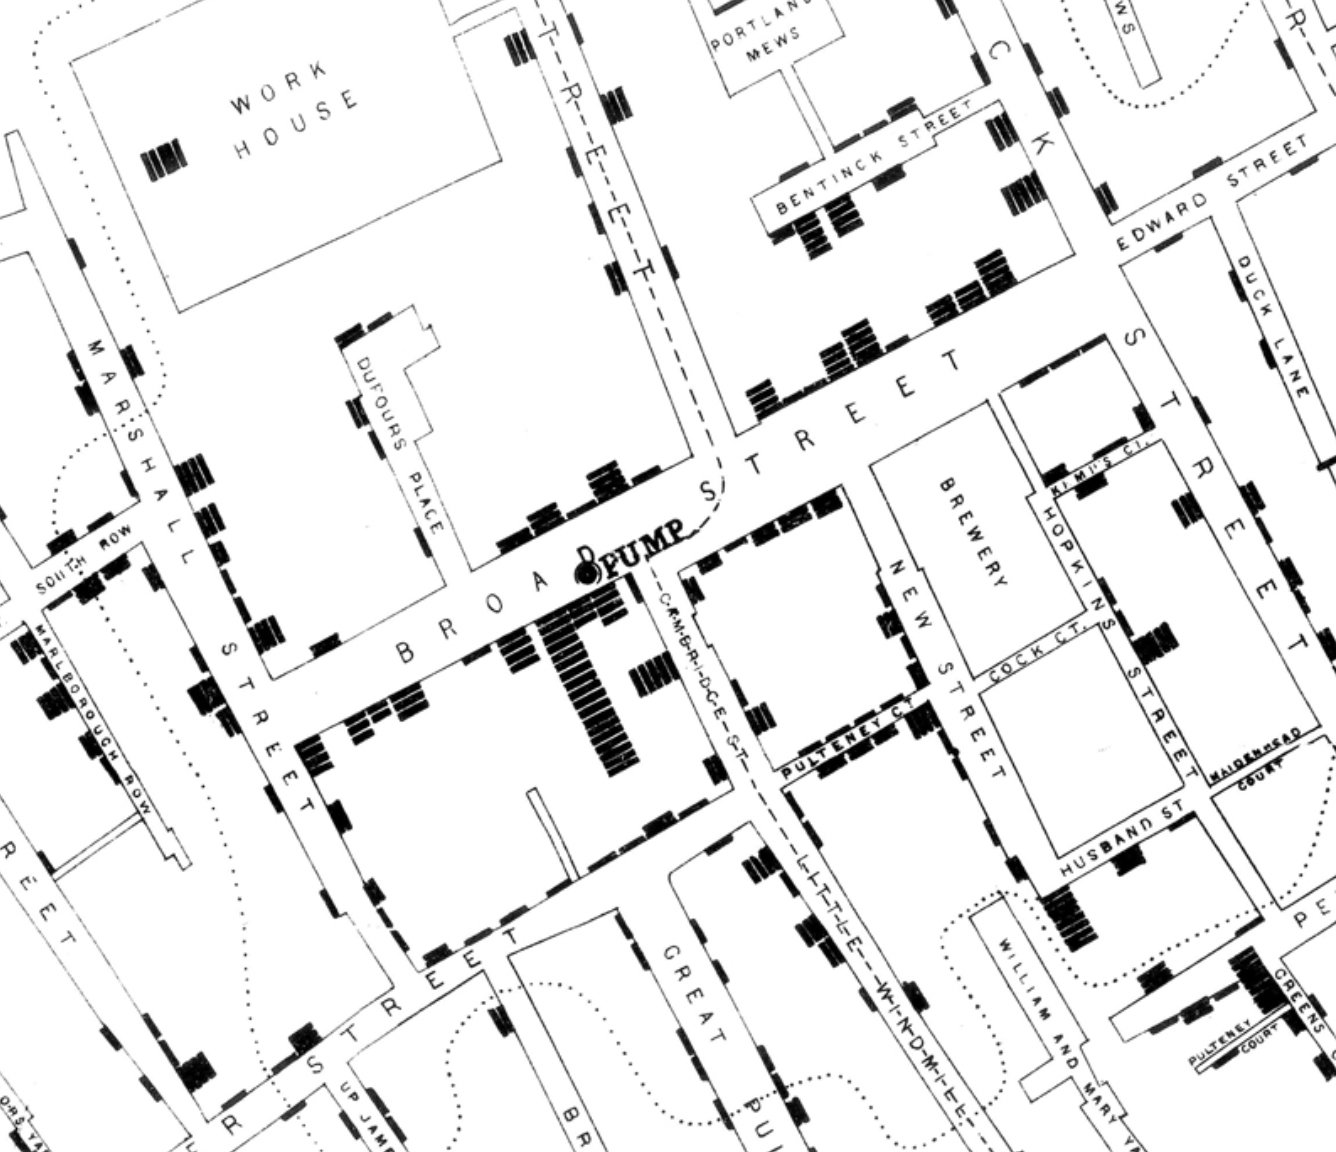
To map and illustrate where certain diseases originated or resided, was crucial information to the public on a number of levels. Maps have been not only crucial in showing where disease is geographically but pinpointing the sources of disease exactly. John Snow’s Cholera map shows where people had contracted and died of cholera in relation to their distance from water pumps during a cholera outbreak in London. Snow noticed that most of the deaths circulated around the Broad Street pump and ultimately indicated cholera was a waterborne or water-spread disease.
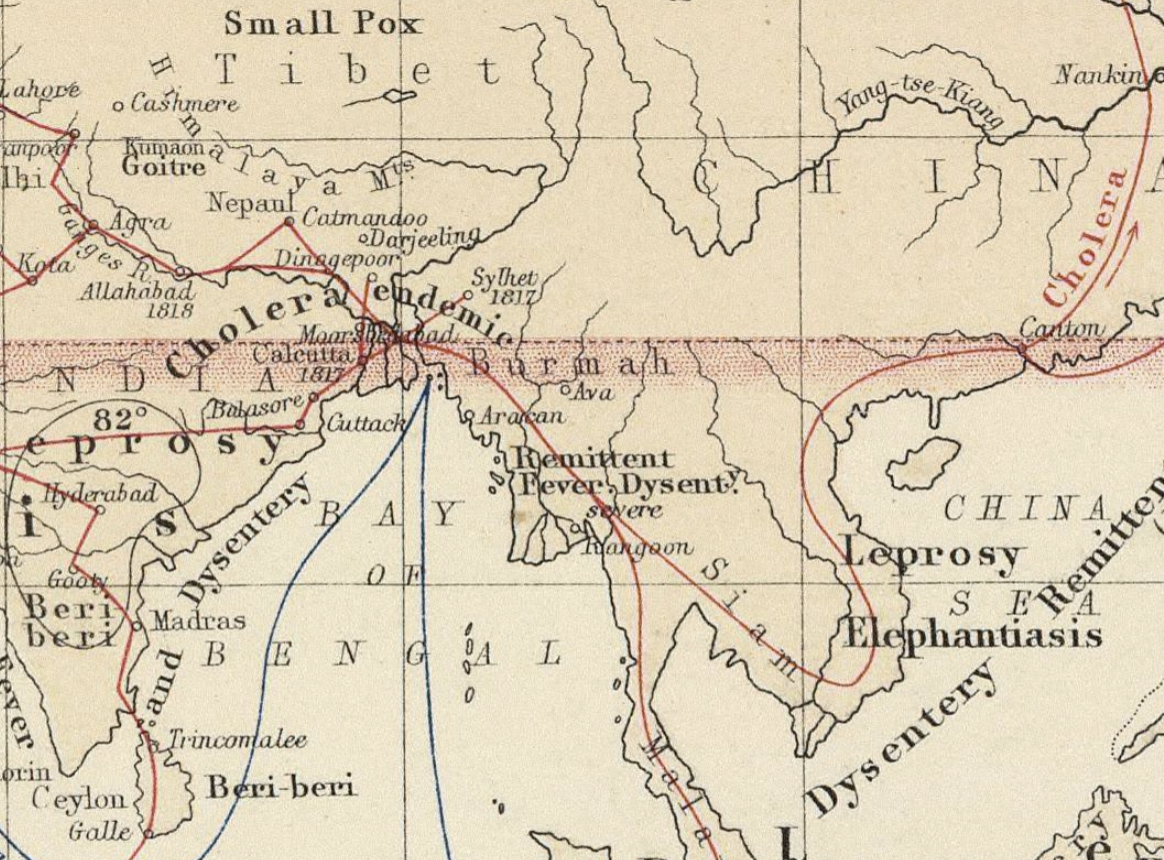
Johnston’s map showing the distribution of disease especially caught my eye because of its intricacy. Johnston uses lines and arrows to show the movement of disease from country to country detailing the mobility of certain diseases like leprosy, cholera, and typhoid. It’s a map that really shows the interconnectedness of the 19th century. Maps likes these could not only be used to show the origins of disease or the spread but to differentiate groups of people with certain disease. This plays back into our research of how maps can tend to separate people.
I had never really considered the mapping of disease to be one of the uses for maps but just seeing it this week, it’s understandable how useful maps like these could have been in the 17th, 18th, and 19th centuries began to connect the world and allow for the circulation of foreign diseases.
Categorize! I love how it emphasizes circulation, which really could be introduced earlier to highlight the connective tissue between the reading and maps!